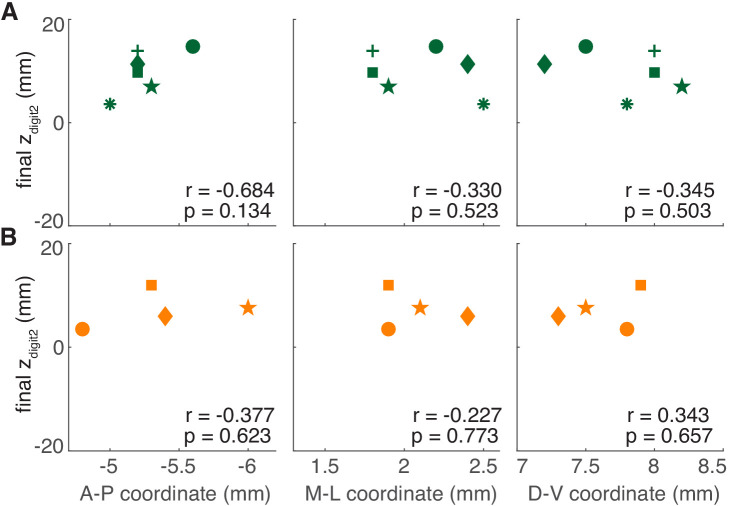
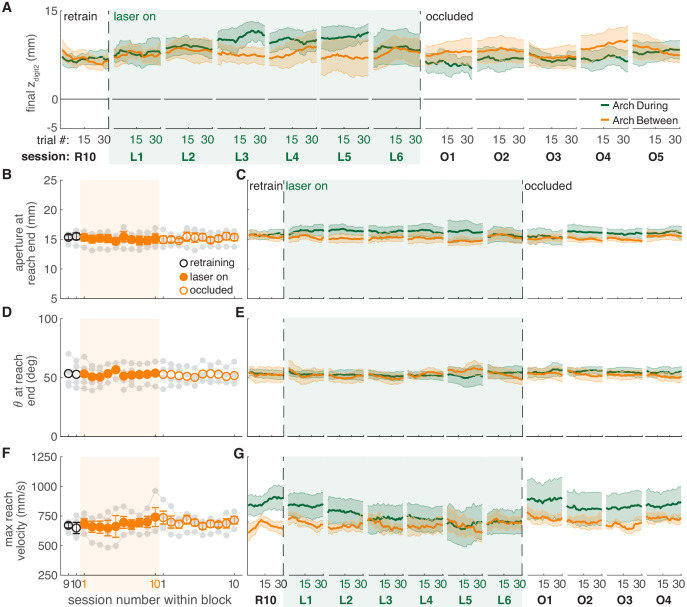
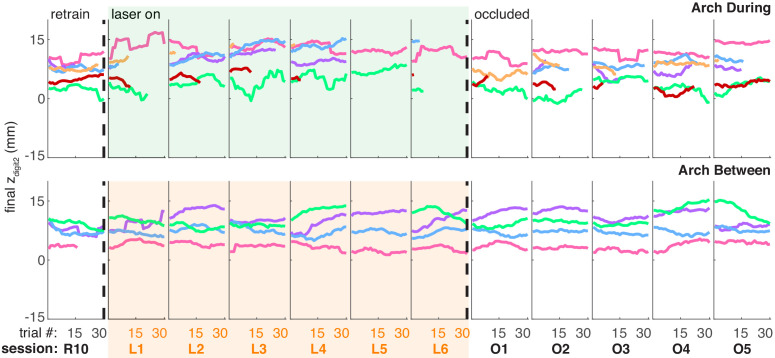
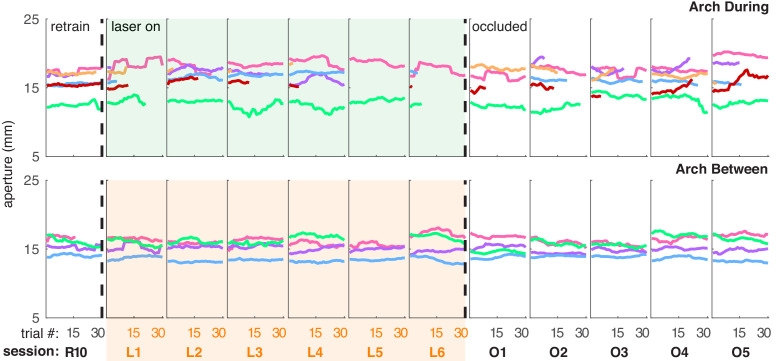
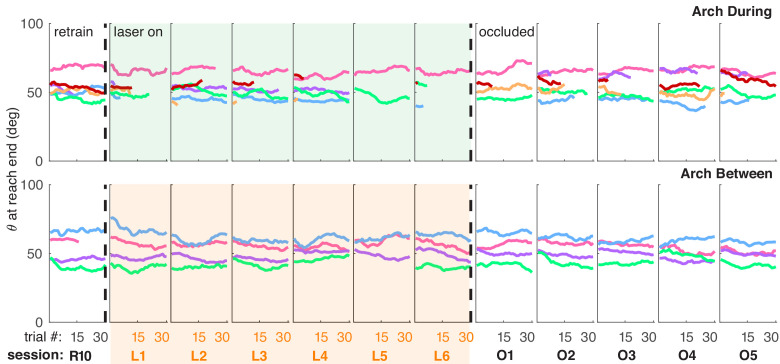
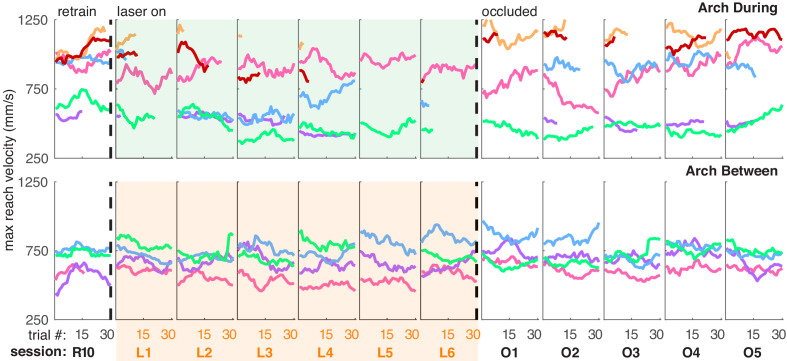
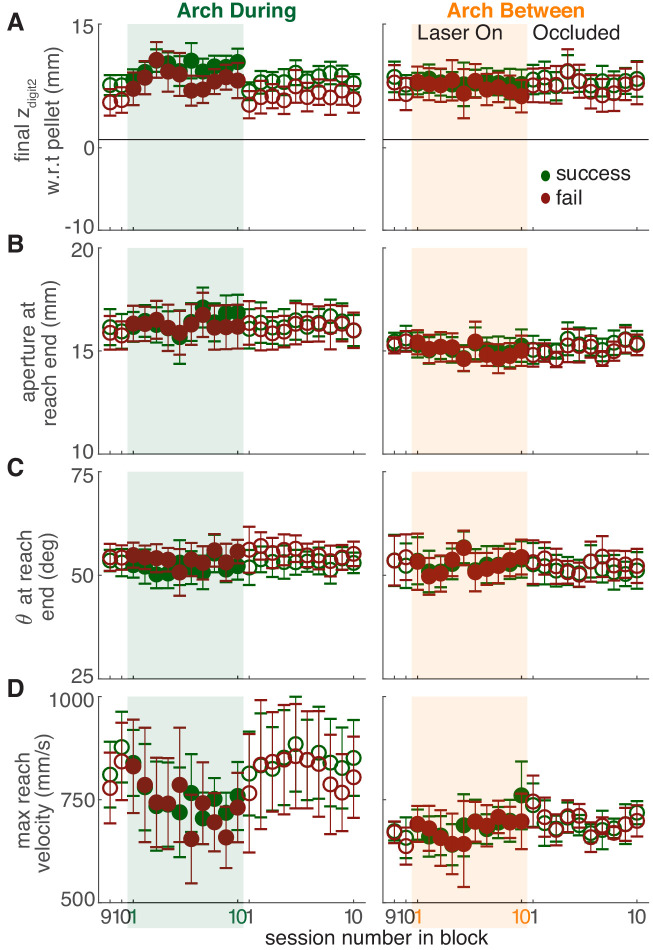
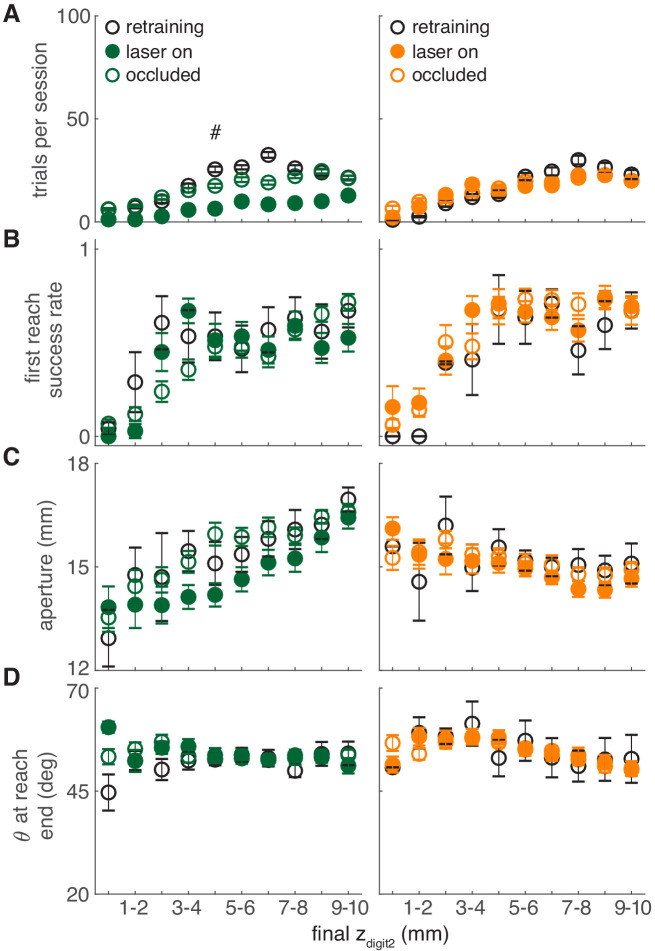
Figure 7. Dopamine neuron inhibition induces subtle changes in reach-to-grasp kinematics.
(A) Average maximum reach extent across sessions for ‘during reach’ inhibition. Linear mixed model: effect of laser: t(63) = −1.72, p=0.09; interaction between laser and session: t(585) = 0.03, p=0.98. (B) Same as (A) for ‘between reach’ inhibition. Linear mixed model: effect of laser: t(63) = −0.23, p=0.82; interaction between laser and session: t(585) = 0.99, p=0.32. Figure 7—figure supplement 1 shows the relationship between reach extent and fiber tip location for these groups. (C) Moving average of maximum reach extent within the last ‘retraining’ sessions, first 6 ‘laser on’ sessions, and first 5 ‘occlusion’ sessions. (D) Same as (A) for aperture: effect of laser: t(48) = 0.53, p=0.60; interaction between laser and session: t(585) = 1.76, p=0.08. (E) Moving average of grasp aperture at reach end within the last ‘retraining’ session, first 6 ‘laser on’ sessions, and first 4 ‘occlusion’ sessions. (F) Same as (A) and (D) for paw orientation: effect of laser: t(75) = −0.20, p=0.84; interaction between laser and session: t(585) = −0.28, p=0.78. (G) Moving average of paw angle at reach end within the last ‘retraining' session, first 6 ‘laser on’ sessions, and first 4 ‘occlusion’ sessions. (H) Same as (A), (D), and (F) for maximum reach velocity: effect of laser: t(49) = −0.52, p=0.60; interaction between laser and session: t(585) = −1.68, p=0.09. (I) Moving average of maximum reach velocity within the last ‘retraining’ session, first 6 ‘laser on’ sessions, and first 4 ‘occlusion’ sessions. ‘R10’, ‘L1’, ‘O1’, etc. indicate the 10th retraining session, first ‘laser on’ session, first ‘occlusion’ session, etc. Shaded colored areas in C, E, G, I and error bars in A, B, D, H represent s.e.m. Similar data for Arch Between rats are shown in Figure 7—figure supplement 2. Individual rat data are shown in Figure 7—figure supplements 3–6. Figure 7—figure supplement 7 compares kinematic measures (final zdigit2, aperture, paw orientation, and maximum reach velocity) between successful and unsuccessful reaches for Arch during and Arch between rats. Figure 7—figure supplement 8 shows success rate and kinematic measures as a function of final zdigit2 for Arch during and Arch between rats. Black bars in (E) and (G) represent trials with a statistically significant difference between groups (Wilcoxon rank sum test, p<0.01).


