. 2020 Nov 27;9:e61591. doi: 10.7554/eLife.61591

Figure 9. Dopamine neuron manipulations disrupt coordination of reach-to-grasp movements.

(A) Mean aperture as a function of paw advancement (zdigit2, pellet at zdigit2 = 0) across ‘laser on’ and ‘occlusion’ sessions for exemplar rats. L1-2, O1-2, … indicate laser on sessions 1–2, occlusion sessions 1–2, etc. (B) Mean aperture as a function of paw advancement across ‘laser on’ and ‘occlusion’ sessions averaged across rats. 4 of 6 ‘ChR2 During’ rats are included because two rats’ reaches were too short in several sessions to produce a meaningful average (the average for all 6 ChR2 During rats, ChR2 Between rats, and Arch Between rats are shown in Figure 9—figure supplement 1). All rats were included for other groups. Dashed lines indicate the zdigit2 coordinate where data are sampled in (C). A more proximal zdigit2 was chosen for ‘ChR2 During’ because the majority of ‘laser on’ reaches for this group did not extend past zdigit2 = +1 mm. (C) Average grasp aperture at the zdigit2 coordinates indicated by the dashed lines in (B) across sessions. ‘During reach’ stimulation gradually increased aperture at 7 mm from the pellet (linear mixed model including all 6 ‘during reach’ rats: effect of laser: t(607) = 2.39, p=0.02; interaction between laser and session: t(607) = 2.40, p=0.02). ‘During reach’ inhibition decreased aperture at 1 mm past the pellet (linear mixed model: effect of laser: t(607) = −2.04, p=0.04; interaction between laser and session: t(607) = 0.67, p=0.51). SNc illumination in EYFP-injected rats had no effect on aperture at 1 mm past the pellet (linear mixed model: effect of laser: t(607) = −0.57, p=0.57; interaction between laser and session: t(607) = −0.61, p=0.54). Gray points indicate data from individual rats. (D) Mean paw orientation as a function of paw advancement towards the pellet across ‘laser on’ and ‘occlusion’ sessions for exemplar rats. All rats are shown in Figure 9—figure supplement 4. (E) Mean paw orientation as a function of paw advancement across ‘laser on’ and ‘occlusion’ sessions averaged across rats. Dashed lines indicate zdigit2 coordinates where data are sampled in (F) for each group. Four of 6 ‘ChR2 During’ rats are included because two rats’ reaches were too short in several sessions to produce a meaningful average (the average for all 6 ChR2 During rats, ChR2 Between rats, and Arch Between rats are shown in Figure 9—figure supplement 1). (F) Average paw orientation at zdigit2 coordinates indicated by dashed lines in (E) across all sessions. ‘During reach’ stimulation caused a gradual increase in pronation (i.e. a smaller angle) at 7 mm from the pellet (linear mixed model including all 6 ‘during reach’ rats: effect of laser: t(607) = −2.34, p=0.02; interaction between laser and session: t(607) = −2.33, p=0.02). ‘During reach’ inhibition had no effect on paw orientation at 1 mm past the pellet (linear mixed model: effect of laser: t(607) = 0.88, p=0.38; interaction between laser and session: t(607) = −0.55, p=0.58). SNc illumination in EYFP-injected rats had no effect on paw orientation at 1 mm past the pellet (linear mixed model: effect of laser: t(607) = −0.51, p=0.61; interaction between laser and session: t(607) = 0.31, p=0.76). Gray points indicate data from individual rats. * indicates p<0.05 for either the laser or laser-session interaction terms in panels C and F. Aperture and orientation as a function of zdigit2 for successful and failed reaches are shown in Figure 9—figure supplements 2,3, respectively. Aperture and orientation as a function of zdigit2 are shown for each rat individually in Figure 9—figure supplements 4,5, respectively.

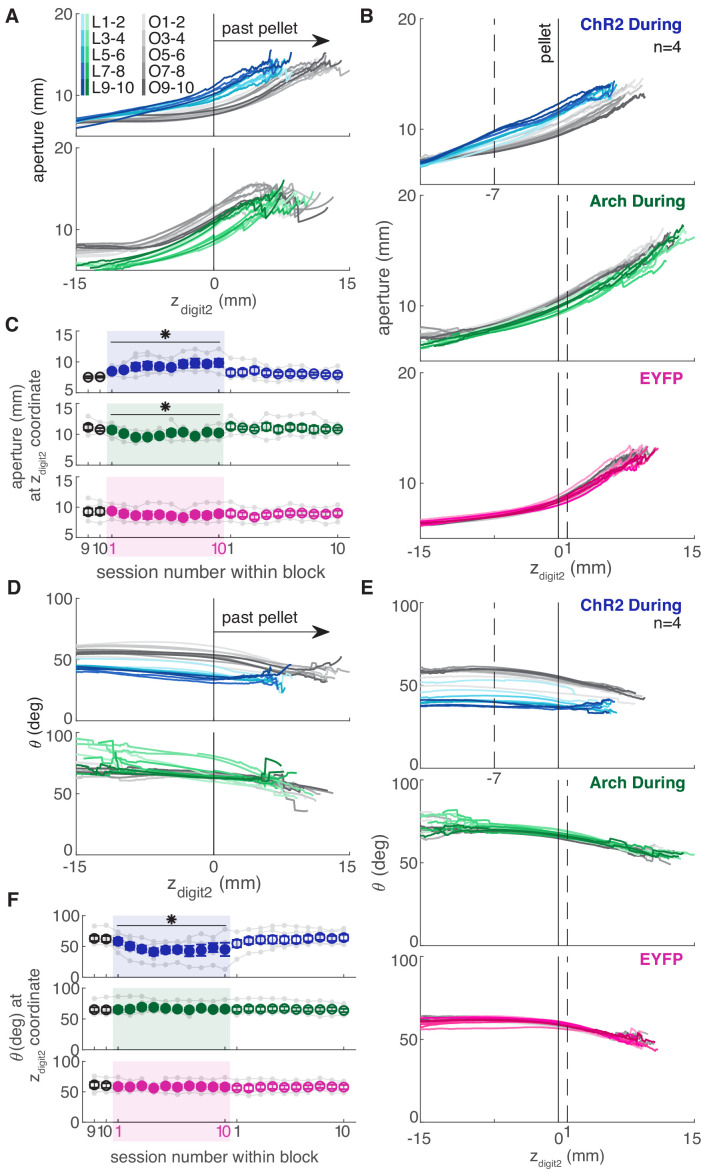
Figure 9—source data 1. A .mat file containing aperture (mean_aperture_traj) and paw orientation (mean_orientation_traj) data along reach trajectories (see Materials and methods for details of calculations) for 22 testing sessions (‘retraining’, ‘laser on’, and ‘occluded’).
Data is average per session for each rat. The field ‘experimentInfo’ provides information on groups.

Figure 9.

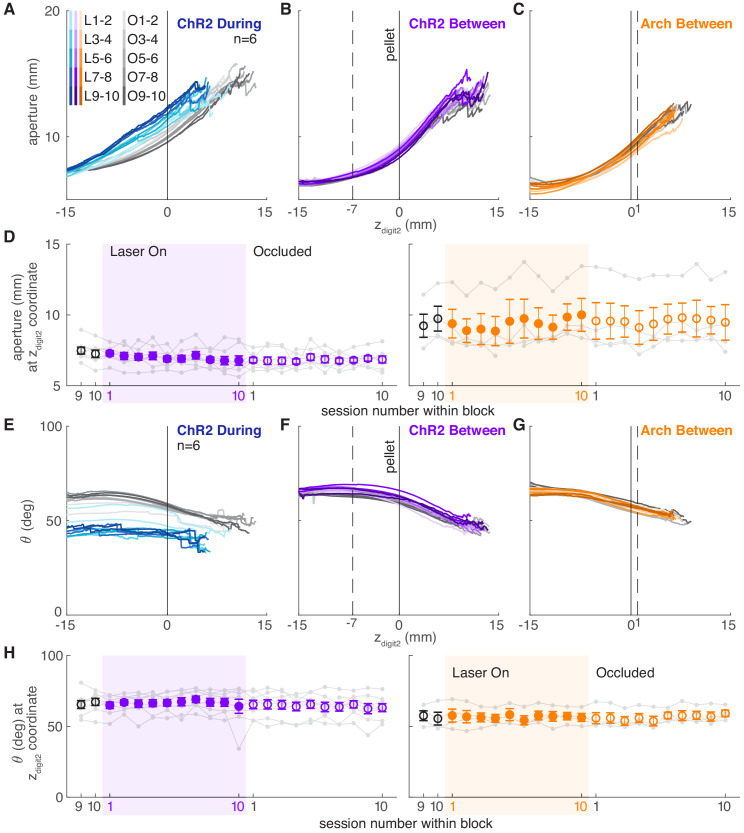
Figure 9—figure supplement 1. Dopamine manipulations between reaches do not affect reach-to-grasp coordination.

Figure 9—figure supplement 1.

(A) Mean aperture as a function of paw advancement in all ‘ChR2 During’ rats (n = 6). L1-2, O1-2, … indicate laser on sessions 1–2, occlusion sessions 1–2, etc. (B) Mean aperture as a function of paw advancement for ‘between reach’ stimulation. (C) Mean aperture as a function of paw advancement for ‘between reach’ inhibition. (D) Average aperture at zdigit2 coordinates indicated by dashed lines in (B) and (C) across all sessions. ‘Between reach’ dopamine neuron stimulation did not affect aperture 7 mm from the pellet (linear mixed model: effect of laser: t(607) = 0.37, p=0.71; interaction between laser and session: t(607) = 0.07, p=0.94) or 1 mm past the pellet (linear mixed model: effect of laser: t(607) = 0.53, p=0.60; interaction between laser and session: t(607) = −0.56, p=0.58). Dopamine neuron inhibition between reaches did not affect aperture 1 mm past the pellet (linear mixed model: effect of laser: t(607) = −0.90, p=0.37; interaction between laser and session: t(607) = 1.82, p=0.07). (E) Mean paw orientation as a function of paw advancement in all ‘ChR2 During’ rats (n = 6). (F) Mean paw orientation as a function of paw advancement for ‘between reach’ stimulation. (G) Mean paw orientation as a function of paw advancement for ‘between reach’ inhibition. (H) Average paw orientation at zdigit2-coordinates indicated by dashed lines in (F) and (G) across all sessions. ‘Between reach’ dopamine neuron stimulation did not affect paw orientation at 7 mm from the pellet (linear mixed model: effect of laser: t(607) = 0.27, p=0.79; interaction between laser and session: t(607) = 0.22, p=0.82) or 1 mm past the pellet (linear mixed model: effect of laser: t(607) = −0.41, p=0.68; interaction between laser and session: t(607) = 1.17, p=0.24). Dopamine neuron inhibition between reaches did not affect paw orientation at 1 mm past the pellet (linear mixed model: effect of laser: t(607) = 0.61, p=0.54; interaction between laser and session: t(607) = −0.36, p=0.72).
Figure 9—figure supplement 1—source data 1. A .mat file containing aperture (mean_aperture_traj) and paw orientation (mean_orientation_traj) data along reach trajectories (see Materials and methods for details of calculations) for 22 testing sessions (‘retraining’, ‘laser on’, and ‘occluded’).
Data is average per session for each rat. The field ‘experimentInfo’ provides information on groups.
Figure 9—figure supplement 2. Mean aperture as a function of paw advancement separated by reach success or failure.

Figure 9—figure supplement 2.

(A) Mean aperture as a function of paw advancement (zdigit2, pellet at zdigit2 = 0) across only ‘laser on’ sessions separated by whether the initial reach was successful (green) or not (red). Dashed lines indicate the zdigit2 coordinate where data are sampled in (B) for each group. A more proximal zdigit2 was chosen for ChR2 groups because the majority of ‘laser on’ reaches for the ‘ChR2 During’ group did not extend past zdigit2 = +1 mm. (B) Average grasp aperture at the zdigit2 coordinates indicated by the dashed lines in (A) across sessions. Aperture did not differ between successful and failed reaches for any groups in the linear mixed model (‘ChR2 During’: interaction between laser and outcome: t(1210) = 0.27, p=0.79; interaction between session, laser, and outcome: t(1210) = −1.50, p=0.13. ‘ChR2 Between’: interaction between laser and outcome: t(1210) = −0.41, p=0.68; interaction between session, laser, and outcome: t(1210) = 0.30, p=0.77. ‘Arch During’: interaction between laser and outcome: t(1210) = 0.70, p=0.49; interaction between session, laser, and outcome: t(1210) = −0.59, p=0.55. ‘Arch Between’: interaction between laser and outcome: t(1210) = 0.54, p=0.59; interaction between session, laser, and outcome: t(1210) = −0.72, p=0.47. ‘EYFP’: interaction between laser and outcome: t(1210) = 0.06, p=0.95; interaction between session, laser, and outcome: t(1210) = 0.35, p=0.73). However, contrast testing revealed differences between successful and failed reaches for ChR2 During rats in laser on sessions 3–10 (t(1210) = −2.42, p=0.02; t(1210) = −3.31, p=9.63×10⁻⁴; t(1210) = −4.17, p=3.30×10⁻⁵; t(1210) = −4.63, p=4.06×10⁻⁶; t(1210) = −4.59, p=4.86×10⁻⁶; t(1210) = −4.29, p=1.92×10⁻⁵; t(1210) = −3.95, p=8.44×10⁻⁵; t(1210) = −3.64, p=2.89×10⁻⁴) and for Arch During rats on session 6 (t(1210) = −2.00, p=0.045). * indicates p<0.05, ** indicates p<0.01, and *** indicates p<0.001 for contrast tests comparing successful to failed reaches for each session.
Figure 9—figure supplement 2—source data 1. A .mat file containing aperture (mean_aperture_traj) data along reach trajectories (see Materials and methods for details of calculations) separated according to trial outcome.
Outcome types are specified in the field ‘outcomeNames’.
Figure 9—figure supplement 2—source data 2. Statistics.
A .xlsx file containing statistical output of post hoc contrast tests comparing mean aperture in successful and failed reaches for each group in panel B.
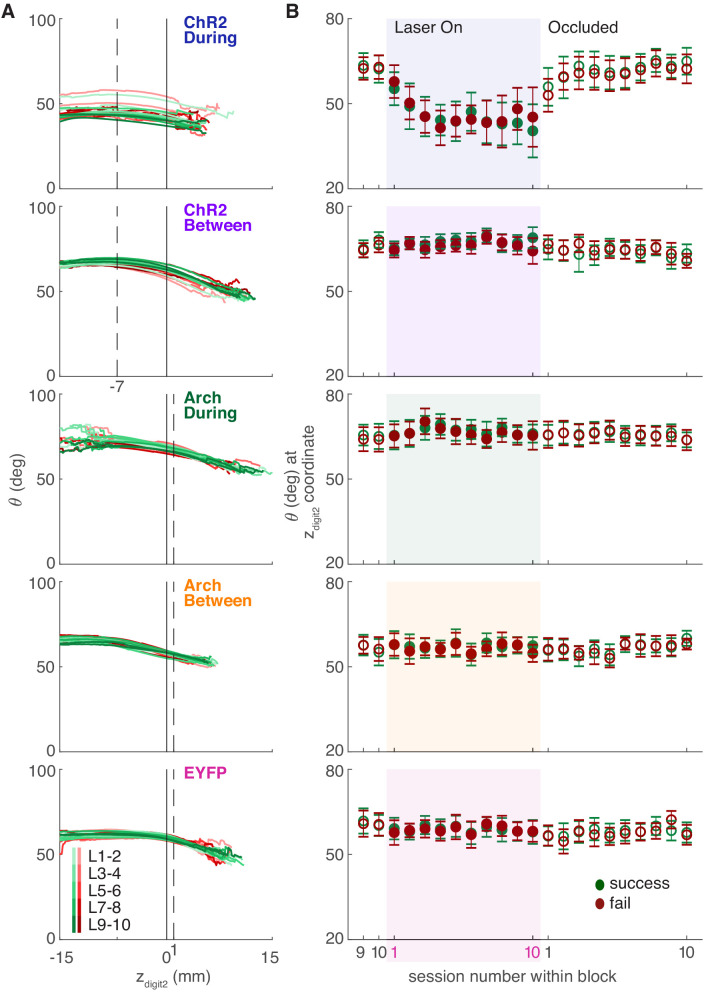
Figure 9—figure supplement 3. Mean paw orientation as a function of paw advancement separated by reach success or failure.

Figure 9—figure supplement 3.

(A) Mean orientation as a function of paw advancement (zdigit2, pellet at zdigit2 = 0) across ‘laser on’ sessions separated by whether the initial reach was successful (green) or not (red). Dashed lines indicate the zdigit2 coordinate where data are sampled in (B) for each group. A more proximal zdigit2 was chosen for ChR2 groups because the majority of ‘laser on’ reaches for the ‘ChR2 During’ group did not extend past zdigit2 = +1 mm. (B) Average paw orientation at the zdigit2 coordinates indicated by the dashed lines in (A) across sessions. Orientation did not differ between successful and failed reaches for any groups. Linear mixed model: ‘ChR2 During’: interaction between laser and outcome: t(1210) = −0.04, p=0.97; interaction between session, laser, and outcome: t(1210) = 0.04, p=0.97. ‘ChR2 Between’: interaction between laser and outcome: t(1210) = −0.20, p=0.84; interaction between session, laser, and outcome: t(1210) = 0.71, p=0.48. ‘Arch During’: interaction between laser and outcome: t(1210) = −0.50, p=0.62; interaction between session, laser, and outcome: t(1210) = 0.77, p=0.44. ‘Arch Between’: interaction between laser and outcome: t(1210) = −0.01, p=0.99; interaction between session, laser, and outcome: t(1210) = 0.29, p=0.77. ‘EYFP’: interaction between laser and outcome: t(1210) = 0.22, p=0.83; interaction between session, laser, and outcome: t(1210) = −0.40, p=0.69.
Figure 9—figure supplement 3—source data 1. A .mat file containing paw orientation (mean_orientation_traj) data along reach trajectories (see Materials and methods for details of calculations) separated according to trial outcome.
Outcome types are specified in the field ‘outcomeNames’.
Figure 9—figure supplement 3—source data 2. Statistics.
A .xlsx file containing statistical output of post hoc contrast tests comparing mean orientation in successful and failed reaches for each group in panel B.
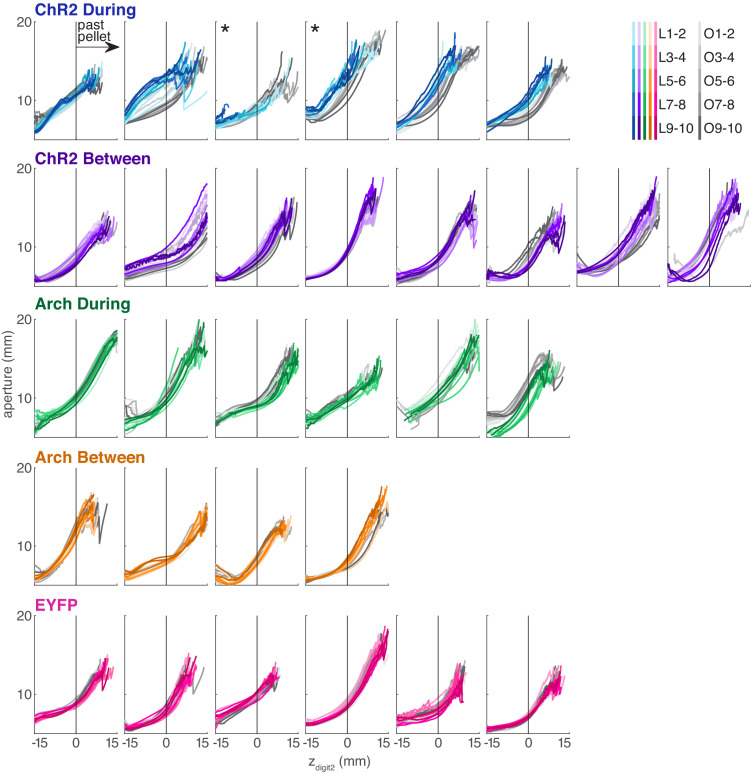
Figure 9—figure supplement 4. Mean aperture as a function of paw advancement for each rat.

Figure 9—figure supplement 4.

From top to bottom: ChR2 during reach stimulation, ChR2 between reach stimulation, Arch during reach inhibition, Arch between reach inhibition and EYFP during reach stimulation. * indicates rats that were excluded from averaged data in Figure 9B (see Materials and methods). In the legend, L1-2, O1-2, … indicate laser on sessions 1–2, occlusion sessions 1–2, etc.
Figure 9—figure supplement 4—source data 1. A .mat file containing aperture (mean_aperture_traj) data along reach trajectories (see Materials and methods for details of calculations) for 22 testing sessions (‘retraining’, ‘laser on’, and ‘occluded’).
Data is average per session for each rat. The field ‘experimentInfo’ provides information on groups.
Figure 9—figure supplement 5. Mean paw orientation as a function of paw advancement for each rat.

Figure 9—figure supplement 5.

From top to bottom: ChR2 during reach stimulation, ChR2 between reach stimulation, Arch during reach inhibition, Arch between reach inhibition, and EYFP during reach stimulation. * indicates rats that were excluded from averaged data in Figure 9E (see Materials and methods). In the legend, L1-2, O1-2, … indicate laser on sessions 1–2, occlusion sessions 1–2, etc.
Figure 9—figure supplement 5—source data 1. A .mat file containing paw orientation (mean_orientation_traj) data along reach trajectories (see Materials and methods for details of calculations) for 22 testing sessions (‘retraining’, ‘laser on’, and ‘occluded’).
Data is average per session for each rat. The field ‘experimentInfo’ provides information on groups.