
FIGURE 2.
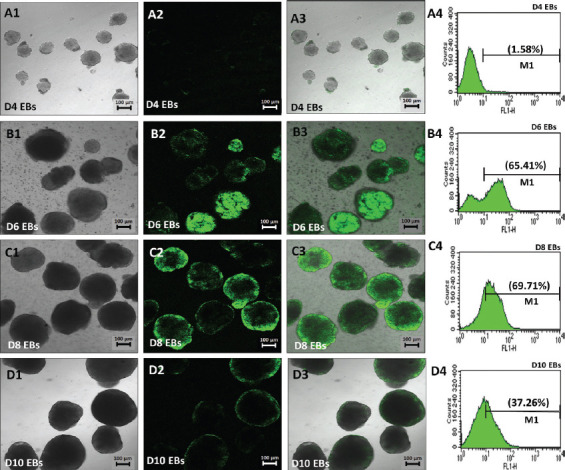
Expression of Sox1eGFP during neural differentiation of 46C cells in vitro on D4, D6, D8, and D10 EBs. A1, B1, C1, and D1 show phase-contrast pictures of EBs and A2, B2, C2, and D2 fluorescence images of EBs with a clear demonstration of the highest Sox1eGFP expression on D8. A3, B3, C3, and D3 demonstrate the merge. A4, B4, C4, and D4 demonstrate the flow cytometry analysis for Sox1eGFP expression during neural differentiation of 46C cells showing that D8 EBs have the highest eGFP expression, which is an indicator of neural differentiation success. The scale bars represent 100 mm for micrographs. D: Day; EBs: Embryoid bodies; GFP: Green fluorescent protein.