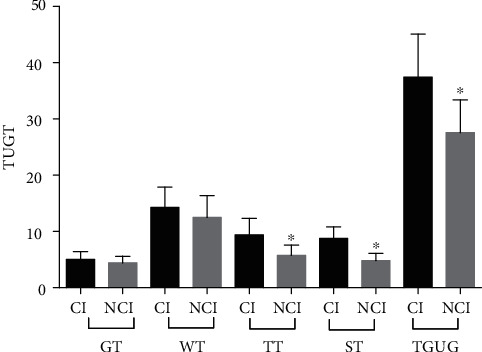
Figure 3.

Differences in the overall time in the Timed “Up and Go” test and the times of the four periods of getting up, walking straight, turning around, and sitting down between the observation and control groups. ∗A P value < 0.05 was considered to indicate statistical significance. GT: getting-up time; WT: walking-straight time; TT: turning-around time; ST: sitting time; TGUG: the total time of “get up and go.”
