Figure 2.

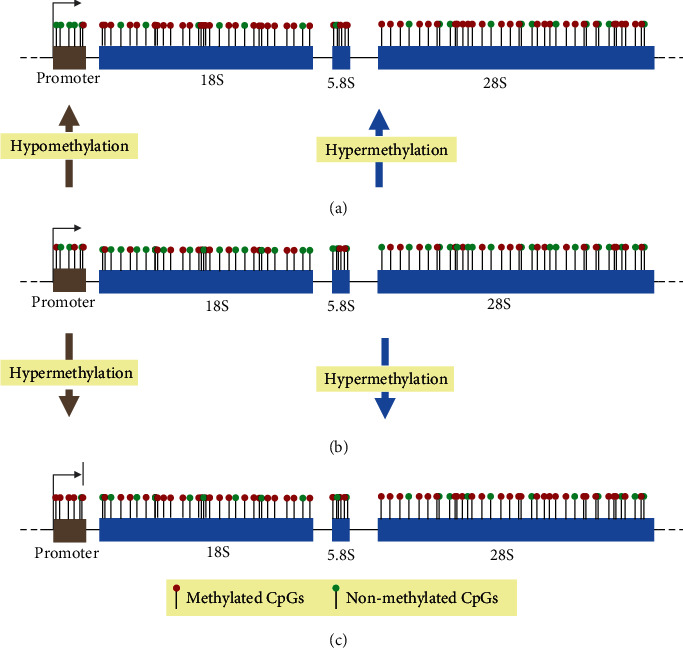
Schematic diagram of the rDNA methylation status between normal (b) and cancer (a) and aging (c) cells. Each vertical bar with circles in red and green represents methylated and non-methylated CpGs, respectively.

Schematic diagram of the rDNA methylation status between normal (b) and cancer (a) and aging (c) cells. Each vertical bar with circles in red and green represents methylated and non-methylated CpGs, respectively.