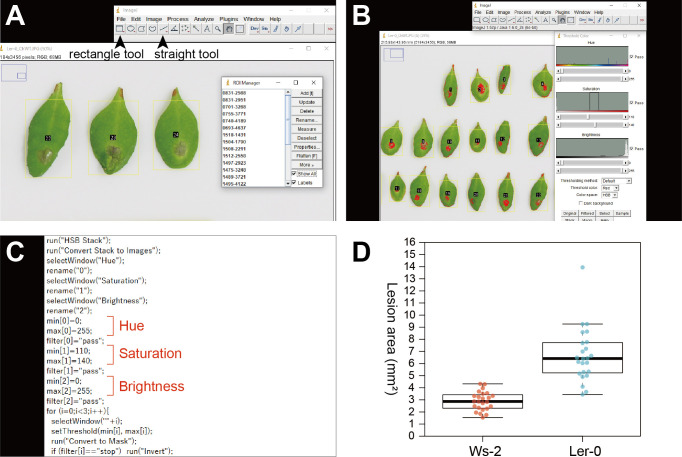
Figure 3. Data analysis using color thresholds in ImageJ.
. A. Setting regions of interest (ROIs) on a photo. Yellow rectangles indicate ROIs that will be measured with color thresholds. Arrow heads indicate the rectangle tool and the straight tool. B. The Threshold Color menu of ImageJ. Red-colored parts in ROIs will be detected as lesions. C. Lesion.ijm opened in a text editor indicating the lines specifying the minimum and maximum thresholds of hue, saturation, and brightness, respectively. D. An expected result using the sample files provided in this article.

