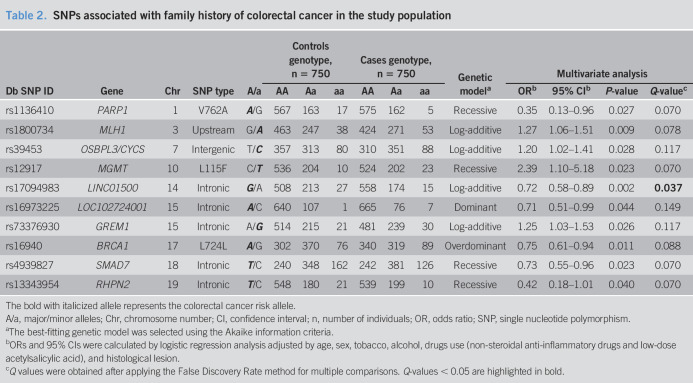
Table 2.
SNPs associated with family history of colorectal cancer in the study population
| Db SNP ID | Gene | Chr | SNP type | A/a | Controls genotype, n = 750 | Cases genotype, n = 750 | Genetic modela | Multivariate analysis | |||||||
| AA | Aa | aa | AA | Aa | aa | ORb | 95% CIb | P-value | Q-valuec | ||||||
| rs1136410 | PARP1 | 1 | V762A | A/G | 567 | 163 | 17 | 575 | 162 | 5 | Recessive | 0.35 | 0.13–0.96 | 0.027 | 0.070 |
| rs1800734 | MLH1 | 3 | Upstream | G/A | 463 | 247 | 38 | 424 | 271 | 53 | Log-additive | 1.27 | 1.06–1.51 | 0.009 | 0.078 |
| rs39453 | OSBPL3/CYCS | 7 | Intergenic | T/C | 357 | 313 | 80 | 310 | 351 | 88 | Log-additive | 1.20 | 1.02–1.41 | 0.028 | 0.117 |
| rs12917 | MGMT | 10 | L115F | C/T | 536 | 204 | 10 | 524 | 202 | 23 | Recessive | 2.39 | 1.10–5.18 | 0.023 | 0.070 |
| rs17094983 | LINC01500 | 14 | Intronic | G/A | 508 | 213 | 27 | 558 | 174 | 15 | Log-additive | 0.72 | 0.58–0.89 | 0.002 | 0.037 |
| rs16973225 | LOC102724001 | 15 | Intronic | A/C | 640 | 107 | 1 | 665 | 76 | 7 | Dominant | 0.71 | 0.51–0.99 | 0.044 | 0.149 |
| rs73376930 | GREM1 | 15 | Intronic | A/G | 514 | 215 | 21 | 481 | 239 | 30 | Log-additive | 1.25 | 1.03–1.53 | 0.026 | 0.117 |
| rs16940 | BRCA1 | 17 | L724L | A/G | 302 | 370 | 76 | 340 | 319 | 89 | Overdominant | 0.75 | 0.61–0.94 | 0.011 | 0.088 |
| rs4939827 | SMAD7 | 18 | Intronic | T/C | 240 | 348 | 162 | 242 | 381 | 126 | Recessive | 0.73 | 0.55–0.96 | 0.023 | 0.070 |
| rs13343954 | RHPN2 | 19 | Intronic | T/C | 548 | 180 | 21 | 539 | 199 | 10 | Recessive | 0.42 | 0.18–1.01 | 0.040 | 0.070 |
The bold with italicized allele represents the colorectal cancer risk allele.
A/a, major/minor alleles; Chr, chromosome number; CI, confidence interval; n, number of individuals; OR, odds ratio; SNP, single nucleotide polymorphism.
The best-fitting genetic model was selected using the Akaike information criteria.
ORs and 95% CIs were calculated by logistic regression analysis adjusted by age, sex, tobacco, alcohol, drugs use (non-steroidal anti-inflammatory drugs and low-dose acetylsalicylic acid), and histological lesion.
Q values were obtained after applying the False Discovery Rate method for multiple comparisons. Q-values < 0.05 are highlighted in bold.

