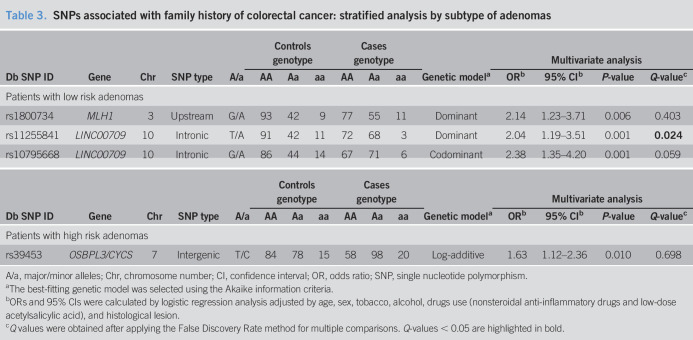
Table 3.
SNPs associated with family history of colorectal cancer: stratified analysis by subtype of adenomas
| Db SNP ID | Gene | Chr | SNP type | A/a | Controls genotype | Cases genotype | Genetic modela | Multivariate analysis | |||||||
| AA | Aa | aa | AA | Aa | aa | ORb | 95% CIb | P-value | Q-valuec | ||||||
| Patients with low risk adenomas | |||||||||||||||
| rs1800734 | MLH1 | 3 | Upstream | G/A | 93 | 42 | 9 | 77 | 55 | 11 | Dominant | 2.14 | 1.23–3.71 | 0.006 | 0.403 |
| rs11255841 | LINC00709 | 10 | Intronic | T/A | 91 | 42 | 11 | 72 | 68 | 3 | Dominant | 2.04 | 1.19–3.51 | 0.001 | 0.024 |
| rs10795668 | LINC00709 | 10 | Intronic | G/A | 86 | 44 | 14 | 67 | 71 | 6 | Codominant | 2.38 | 1.35–4.20 | 0.001 | 0.059 |
| Db SNP ID | Gene | Chr | SNP type | A/a | Controls genotype | Cases genotype | Genetic modela | Multivariate analysis | |||||||
| AA | Aa | aa | AA | Aa | aa | ORb | 95% CIb | P-value | Q-valuec | ||||||
| Patients with high risk adenomas | |||||||||||||||
| rs39453 | OSBPL3/CYCS | 7 | Intergenic | T/C | 84 | 78 | 15 | 58 | 98 | 20 | Log-additive | 1.63 | 1.12–2.36 | 0.010 | 0.698 |
A/a, major/minor alleles; Chr, chromosome number; CI, confidence interval; OR, odds ratio; SNP, single nucleotide polymorphism.
The best-fitting genetic model was selected using the Akaike information criteria.
ORs and 95% CIs were calculated by logistic regression analysis adjusted by age, sex, tobacco, alcohol, drugs use (nonsteroidal anti-inflammatory drugs and low-dose acetylsalicylic acid), and histological lesion.
Q values were obtained after applying the False Discovery Rate method for multiple comparisons. Q-values < 0.05 are highlighted in bold.

