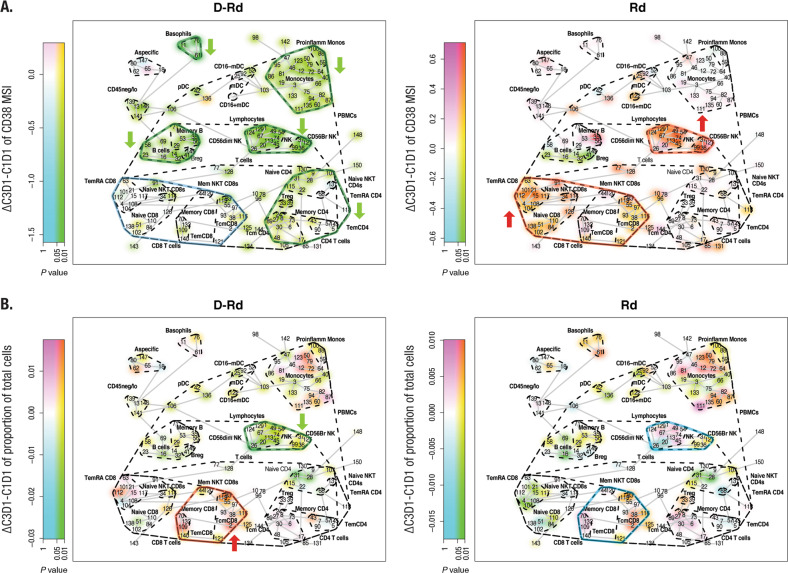
Fig. 1. D-Rd and Rd mediated changes of mean CD38 expression on immune cell populations and mean total immune cell populations after 2 months of therapy.
Panel a shows the mean CD38 expression on immune cell populations and panel b shows the mean total immune cell populations after 2 months of therapy for D-Rd treatment (left) and Rd treatment (right). The visualization method used is the SPADE‐blend tree with which the differential testing results (here, contrasting pre‐ versus on‐treatment sample data) are projected as colored highlighting on the SPADE tree to maximize exploration of the statistical analysis results, simultaneously, in the samples under investigation. Br bright, Breg regulatory B cell, D-Rd daratumumab plus lenalidomide and dexamethasone, mDC myeloid dendritic cell, Monos monocytes, NK natural killer, NKT natural killer T cell, PBMC peripheral blood mononuclear cell, pDC plasmacytoid dendritic cell, Rd lenalidomide and dexamethasone, Tem effector memory T cell, TEMRA effector memory CD45RA+ T cell, Treg regulatory T cell. Nodes are colored by decrease (cyan; green, if significant [raw P value]) or increase (magenta; red, if significant [raw P value]).

