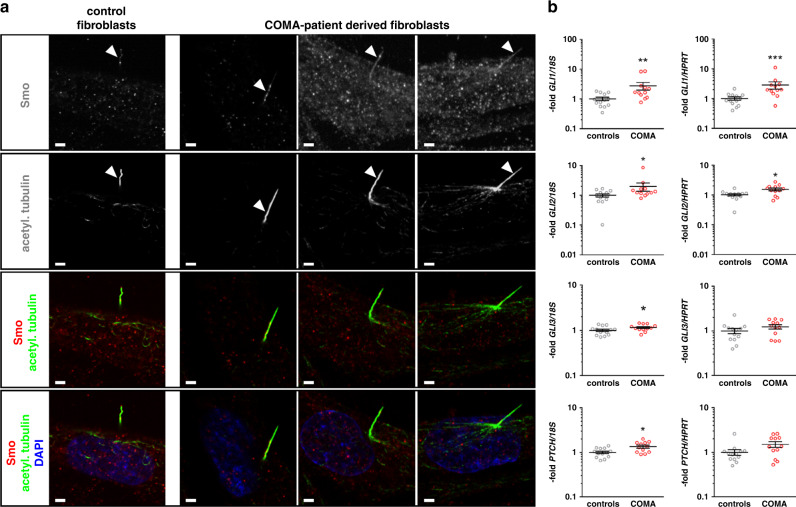
Fig. 4. Cilia formation and expression of Hedgehog signaling signature genes in congenital ocular motor apraxia (COMA) patient–derived dermal fibroblasts.
(a) Representative pictures of double immunofluorescent staining for visualization of SMO (upper row in monochrome, third and lower row in red) and acetylated tubulin (acetyl.tubulin) (second row in monochrome, third and lower row in green) in control fibroblasts and fibroblasts derived from affected individual II.2 (family 3, first column), individual II.1 (family 2, middle column), and individual II.1 (family 4, right column). Nuclei were visualized by DAPI staining (lower row in blue). Scale bars: 1 µm. (b) Quantitative real-time polymerase chain reaction (PCR)–based expression analyses of the Hedgehog signaling signature genes GLI1, GLI2, GLI3, and PTCH1 normalized to 18S ribosomal RNA (rRNA) (left column) or HPRT (right column) expression levels, respectively, of controls (N = 5) and COMA patient–derived fibroblasts (COMA) (N = 4). Shown results represent data of two different cellular passages per fibroblast culture each analyzed in biological triplicates (gray circles) that were measured in technical triplicates. Total mean values +/- SEM of all analyzed samples are indicated in black. Significant differences were tested by nonparametric Mann–Whitney tests. *p < 0.05; **p < 0.01; ***p < 0.001. No significantly different expression levels were observed in the five independent control fibroblast cultures, different cellular passages, or biological triplicates. For comparison of individual gene expression levels of the four independent COMA patient–derived fibroblast cultures as well as HIP expression levels see Supplemental Data (Fig. S1).

