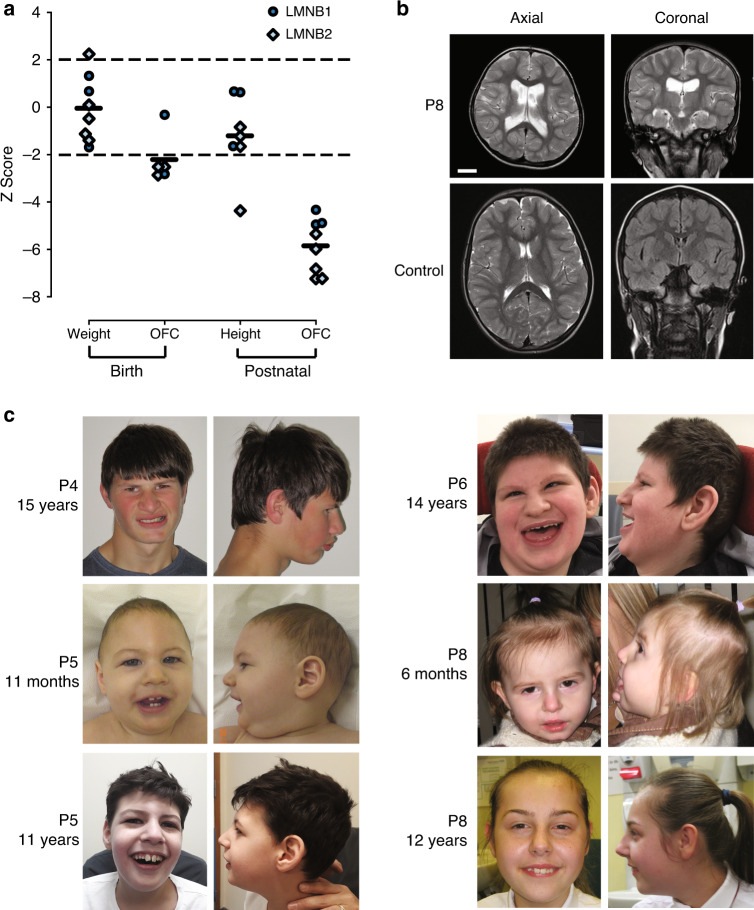
Fig. 2. Pathogenic LMNB1 or LMNB2 variants in patients with primary microcephaly.
(a) Growth parameters of individuals with pathogenic LMNB1/2 variants plotted as Z-scores (standard deviations from the age and sex-matched mean). Black bars, mean Z-score. Dashed lines, 95% confidence interval for general population. (b) Neuroimaging demonstrates reduced cortical size with simplified gyri. Ventricular dilatation reflects accompanying global reduction in white matter. Comparison with age-matched control. Scale bar 2 cm. Axial images, T2-weighted. Coronal, T2 (P8), fluid-attenuated inversion recovery (FLAIR) (control). (c) Photographs of individuals P4, P5, P6, and P8. Written consent obtained from families for photography. OFC occipital frontal circumference.

