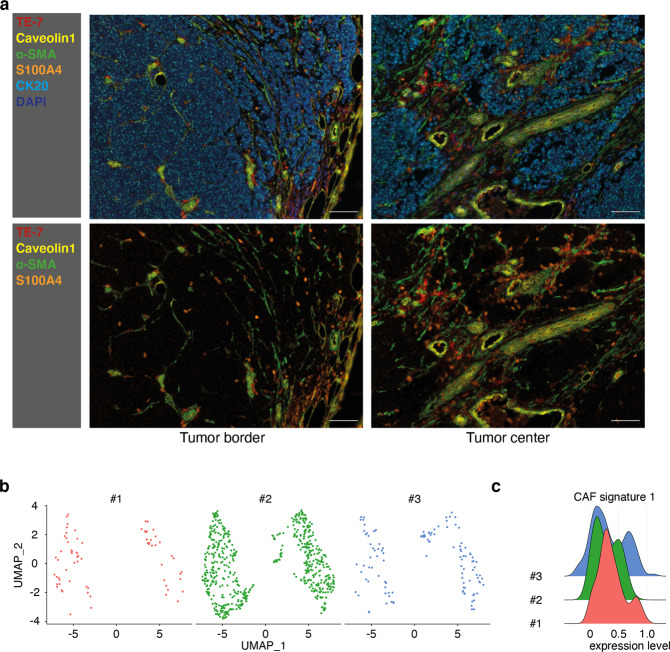
Fig. 1. Fibroblasts in MCC tumors exhibit a CAF-like phenotype.
a FFPE sections of MCC tissues were stained for the fibroblast markers TE-7 (red), Caveolin1 (yellow), α-SMA (green), and S100A4 (orange), as well as for the MCC tumor marker CK20 (light blue). Nuclei were stained with DAPI (dark blue). A representative MCC tissue is depicted. The scale bar represents 50 µm. b Fibroblasts visualized in a UMAP plot. Cells were annotated by mRNA expression profiles for known marker genes in three MCC tumors. c A CAF signature score was generated for fibroblasts in three tumors based on the mRNA expression of selected CAF marker genes (details are given in the “Material and Methods” section).

