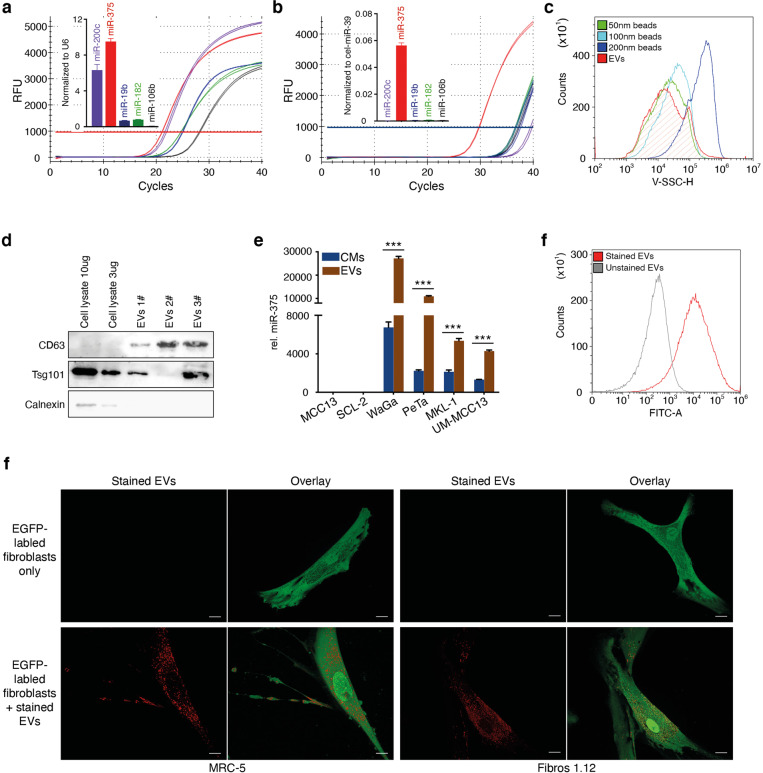
Fig. 2. Fibroblasts take up MCC-derived EVs containing miR-375.
The expression of miR-375, miR-182, miR-106b, miR-19b and miR-200c in WaGa cells (a) and CM from WaGa cells (b) was determined by RT-qPCR. The amplification curves and normalized relative expression level of each miRNA are shown. c EVs were isolated from WaGa CM. The sizes were determined by comparison to nanobeads of a defined size (50, 100, and 200 nm). d Expression of CD63, Tsg101 and Calnexin in WaGa cells and EVs derived from WaGa CMs were determined via immunoblot. e Relative miR-375 expression in EVs derived from four classical MCC cell lines (WaGa, PeTa, MKL-1, UM-MCC13) and a variant MCC cell line (MCC13) and SCL-2 cutaneous squamous cell carcinoma cells served as the control. Cq values were normalized to spiked-in cel-miR-39. f EVs isolated from WaGa cells were stained with Exo-Red; unstained EVs served as negative controls. g EGFP-expressing MRC-5 cells (left panels) or primary skin fibroblasts (Fibro.1.12, right panels) were cultured alone or in the presence of Exo-Red-labeled WaGa cell-derived EVs. Representative overlay images are shown; the scale bar represents 10 µm. Experiments were biologically replicated trice and were performed in triplicates. The error bars indicate the SDs; *** indicates p < 0.001.

