
Fig. 3.
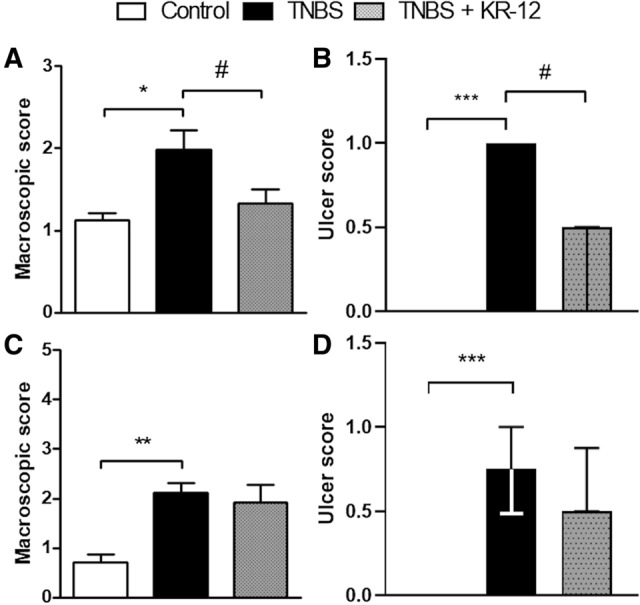
The effect of KR-12 on macroscopic and ulcer score in the semi-chronic (a–b) and chronic (c–d) models of colitis induced by TNBS. *p < 0.05, **p < 0.01, ***p < 0.001 as compared to control mice, #p < 0.05, ###p < 0.001 as compared to TNBS-treated animals. In case of a and c statistics the data was distributed normally, one-way ANOVA with Newman-Keuls as a post hoc test was used. Data represent mean ± SEM of 8–10 mice per group. In case of b and d statistics, the data were not distributed normally and thus the Kruskal–Wallis test was used. Data represent median with interquartile range of 8–10 mice per group