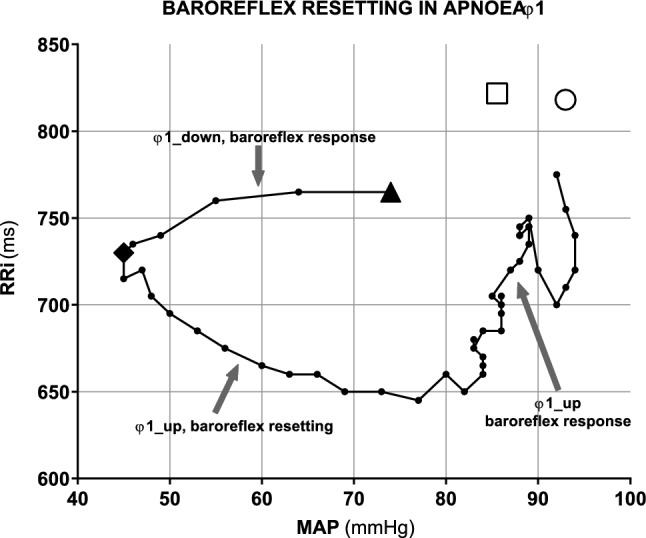
Fig. 2.

Closed-loop contour plot of the relationship between R-to-R interval (RRi) and mean arterial pressure (MAP) during φ1 in resting apnoea. Data obtained from a representative subject, showing the presence of a baroreflex responses before the attainment of minimum of mean arterial pressure (MAPmin, black diamond). The resetting phase starts from the diamond point: during this phase, RRi and MAP vary in opposite directions toward a new operating point in φ2 (white circle). White square: operating point at steady state before apnoea. Black tringle: beginning of apnoeas
