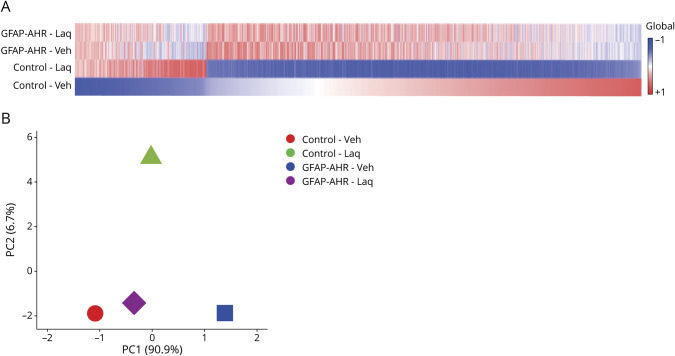
Figure 3. Laquinimod Acts on Astrocytes by Modulating the Production of Proinflammatory Cytokines, Chemokines, and Neurotoxic Mediators.
(A) Heat map of expressed (detected at level 0.1 in at least 2 of 3 samples) genes (signal:noise ratio) of astrocytes fluorescence-activated cell sorting sorted from animals as in (figure 2A). Data represent means of n = 3 mice. Gene expression levels are row centered and log2 transformed and saturated at levels −0.5 and +0.5 for visualization satisfying a false discovery rate <0.1. (B) Principal component analysis plot of RNA sequencing data isolated from microglia of mice as in (A). AHR = aryl hydrocarbon receptor; GFAP = glial fibrillary acidic protein.

