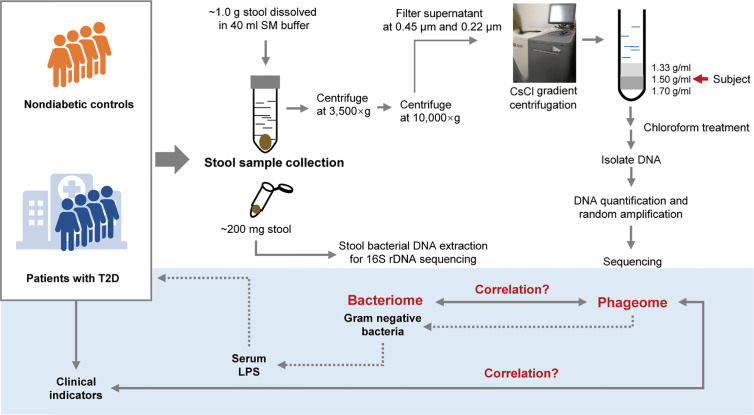
Figure 1.
Schematic diagram of this study. The light-blue part is a sketch map of the preliminary exploration herein, including exploring the relationship between the phageome and putative host bacterial microbiome, correlation between the phageome and type 2 diabetes (T2D) disease indicators, and discussion of the potential connection between the increase in serum lipopolysaccharide (LPS) content and the changes in bacteriophages.

