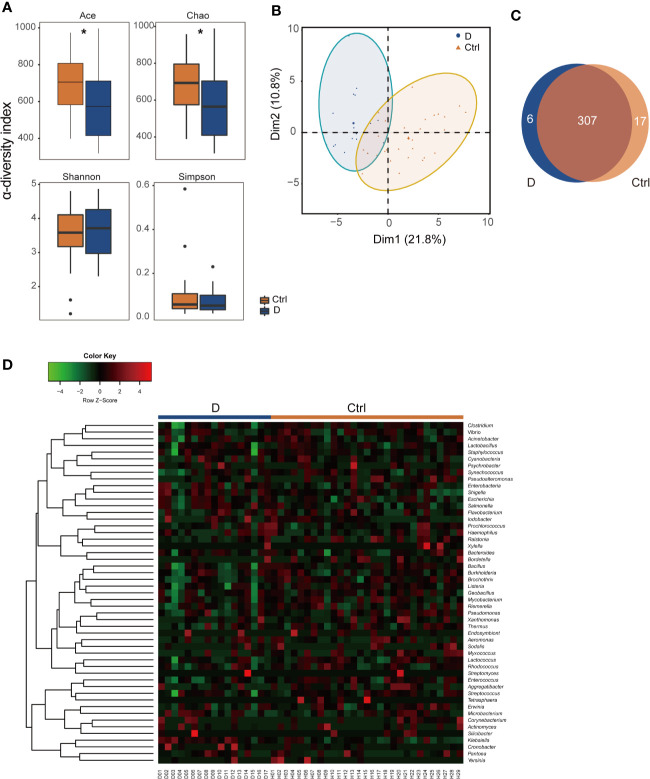
Figure 2.
Illustration of the identified phageome characteristics. (A) α-diversity indexes of the phageome in the type 2 diabetes (T2D) group (N=17) and Ctrl group (N=29). (B) Principal component analysis (PCA) of the phageome in the T2D group and Ctrl group. PCA plot of phageome samples from diabetes patients (blue dots) and controls (orange triangles). The first component (dim1) explained 21.8% of the total variance, and the dim2 explained 10.8%. (C) Venn diagram for the number distribution of phages classified by bacterial hosts in the two groups. (D) Heatmap of the identified phages in T2D patients and nondiabetic controls according to their corresponding bacterial hosts. *p < 0.05.

