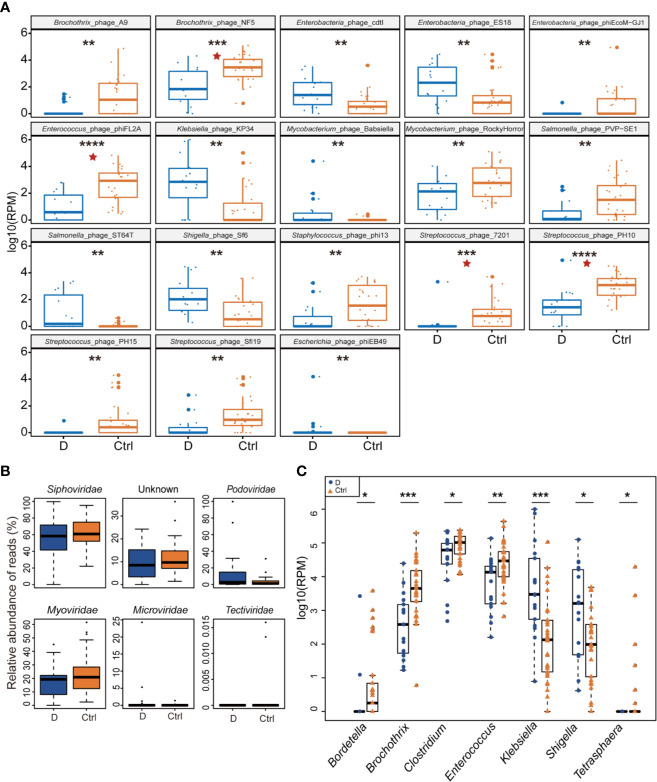
Figure 3.
Differential abundance of phage-infected bacterial taxonomy between type 2 diabetes (T2D) patients (N=17) and controls (N=29). (A) The 18 bacteriophages with the most significant difference in the T2D group. (B) Differentially detected viruses at the level of families. (C) Phages clustered by 7 bacterial genus hosts that changed significantly in the T2D group. *p< 0.05, **p< 0.01, ***p< 0.001, ****p< 0.001. pentagram: FDR < 0.05.

