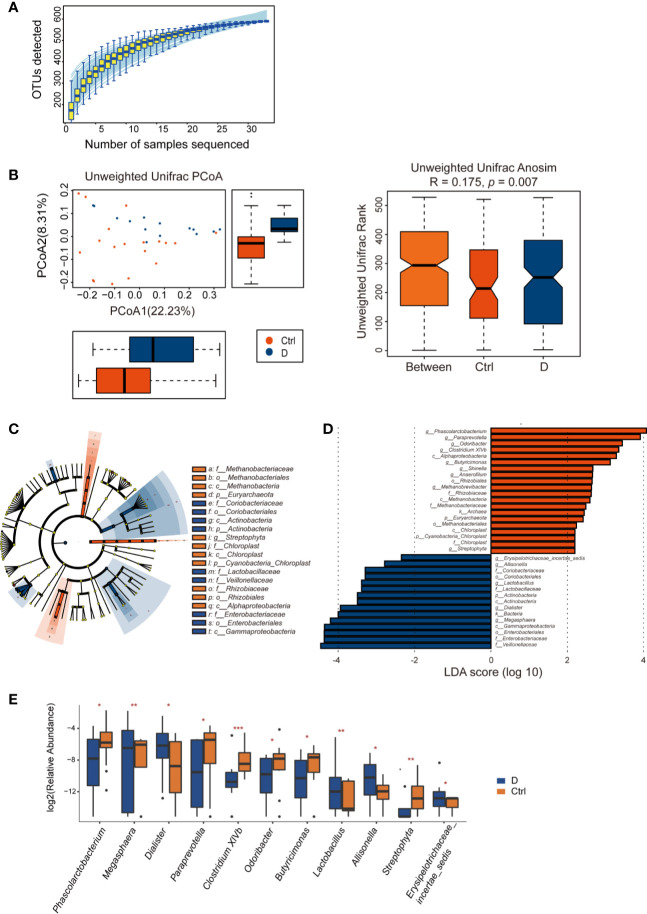
Figure 4.
Alterations in the fecal bacterial microbiome in the study. (A) Species accumulation curve for the fecal samples. (B) Unweighted UniFrac principal coordinate analysis (PCoA) and analysis of similarities (ANOSIM) of the bacterial microbiome in the type 2 diabetes (T2D) group (N=17) and Ctrl group (N=20) taxonomic cladogram (C) and LDA (D) were obtained using LEfSe of the 16S sequences in the type 2 diabetes (T2D) group (in blue) and Ctrl group (in orange). (E) Significantly altered bacterial genera in the T2D group. *p < 0.05, **p < 0.01, ***p < 0.001.

