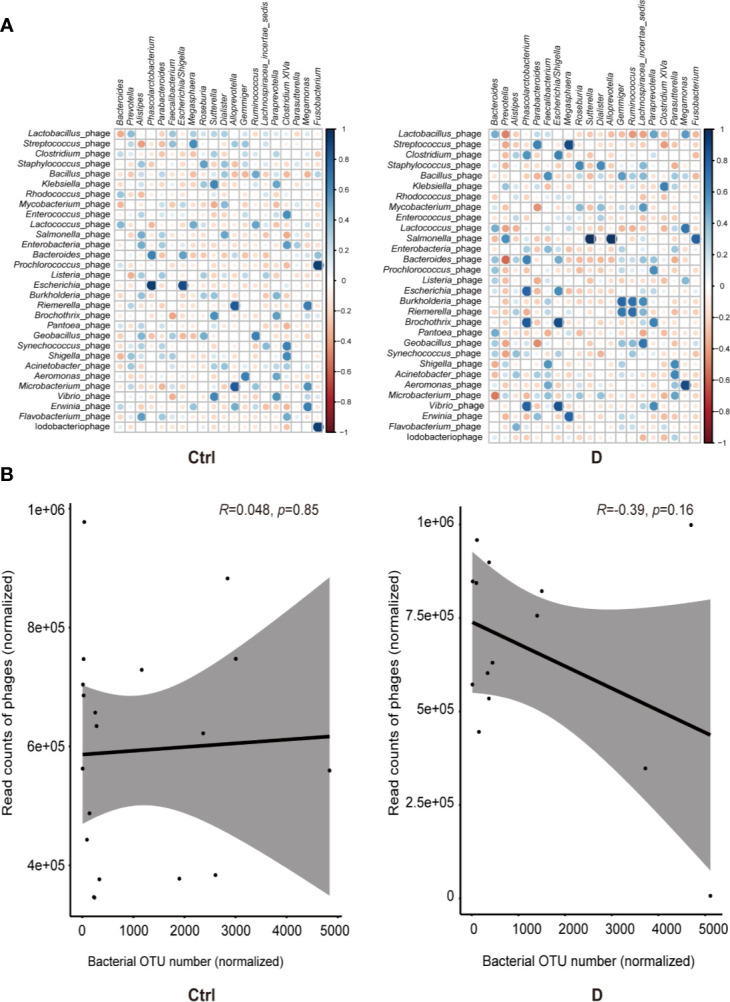
Figure 5.

Bacterium-phage correlations in fecal samples from type 2 diabetes (T2D) patients and nondiabetic controls. (A) Results of Spearman correlation analysis between the most abundant 20 bacterial genera and the most abundant 30 species of phage. Blue circles indicate positive correlations, and red circles indicate negative correlations. The size and shading indicate the magnitude of the correlation, where darker shades denote more intensive correlations than light ones. (B) Correlations of the relative abundance of phages and their bacterial hosts in the T2D group and Ctrl group. The relative abundance was represented by the normalized operational taxonomic units (OTU) number. Optimal regression lines for the 95% confidence interval are plotted.
