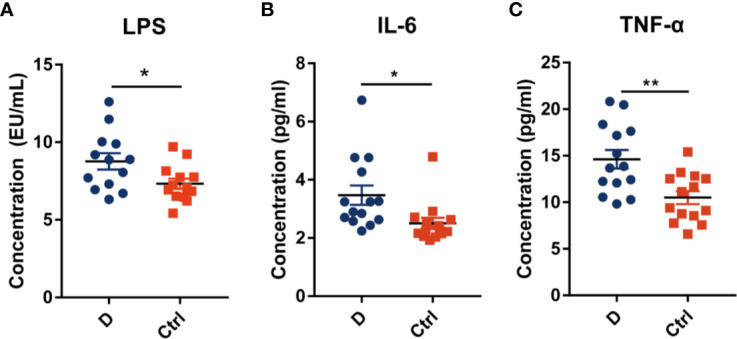
Figure 6.

Circulating endotoxin and pro-inflammation cytokines levels in serum. (A) The concentration of circulating endotoxin. In each group, N=14. Quantitative analysis of serum IL-6 (B) and TNF-α (C) in type 2 diabetes patients and nondiabetic controls. N=14 for each group. All data are expressed as mean ± SEM. *p < 0.05, **p < 0.01.
