Figure 8.
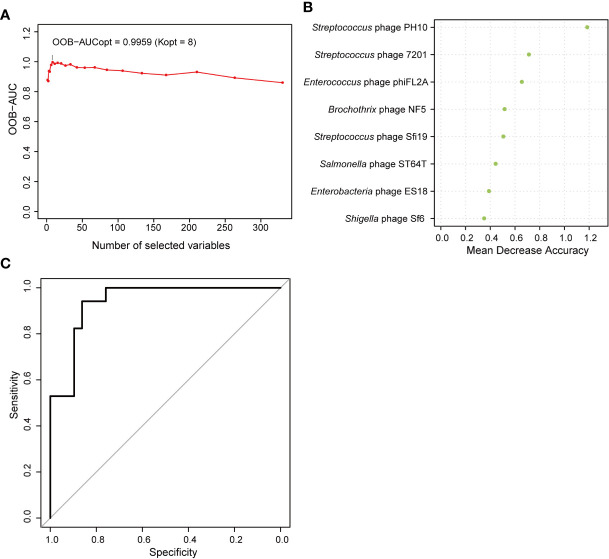
Random forest features for distinguishing type 2 diabetes (T2D) from nondiabetic subjects. (A) The change in area under the curve (AUC) values when selecting different numbers of phages. (B) Order of the importance of each phage in this model. (C) Receiver operating characteristic curve (ROC) analysis of sensitivity and specificity of the eight phages for prediction of T2D.

