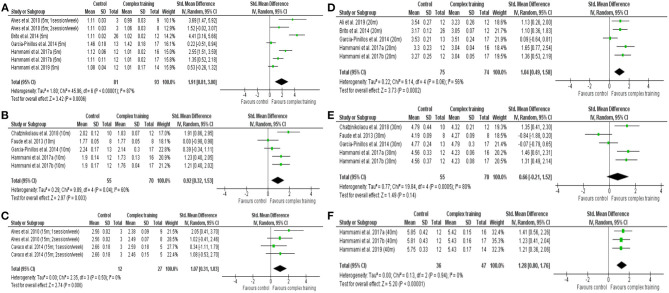
Figure 2.
Forest plot of standardized mean difference in post-intervention outcomes between complex training group and control group, including (A) 5-m sprint time, (B) 10-m sprint time, (C) 15-m sprint time, (D) 20-m sprint time, (E) 30-m sprint time, (F) 40-m sprint time. Note: the relative weight of each study in the analysis is indicated by the size of the green squares.

