FIGURE 3.
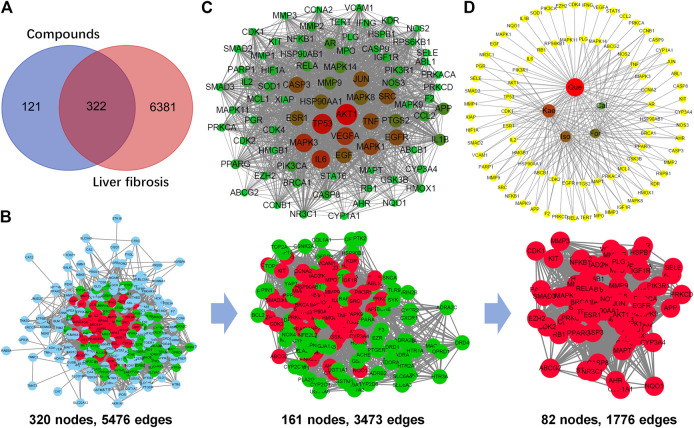
Analysis of the key targets of the flavonoids for the treatment of liver fibrosis. (A) Venn diagram summarizing the differential targets of the flavonoids and liver fibrosis. (B) The process of topological screening for the protein-protein interaction (PPI) network. Finally, 82 candidate targets were predicted. (C) The PPI network of the 82 nodes. Different colors represent nodes of different sizes. The red nodes represent the large hub nodes and the green nodes represent the small hub nodes. The node size is proportional to the target degree in the network. (D) Compound target network (C-T network) of the flavonoids and 82 key targets.

