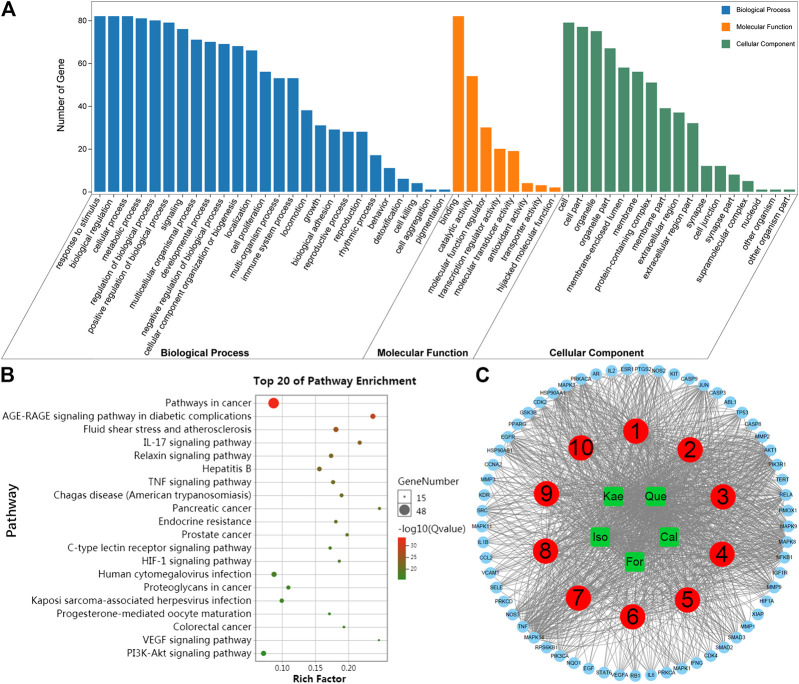
FIGURE 4.
Enrichment analysis of the key targets of the flavonoids against liver fibrosis. (A) GO enrichment analysis of the 82 key targets. Biological processes, cellular components, and molecular function terms were performed on the targets. The top significant (the cutoff criterion for a significant difference was p < 0.05) GO categories are shown. (B) KEGG enrichment analysis of the 82 key targets. The top 20 KEGG pathway enrichments are displayed, and only terms with FDR < 0.05 were selected for analysis. (C) Compound-target-pathway network. The red round nodes represent the top ten pathways, the green round nodes represent the flavonoids, and the blue triangles represent the related targets.

