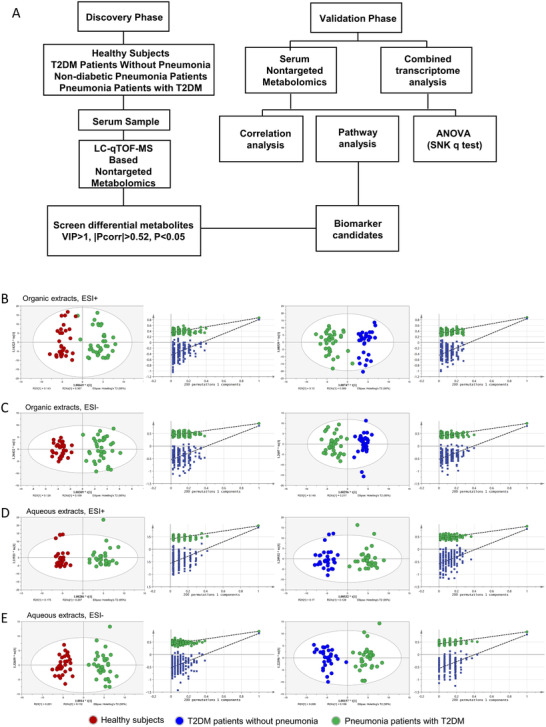
FIGURE 1.

The Scheme of exploration on metabolic profile of pneumonia patients with T2DM. (A) Scheme of this study. (B‐E) The OPLS‐DA score in four modules of metabolomics analysis via UPLC‐QTOF/MS: organic extracts in the (B) ESI+ mode and (C) ESI− mode; aqueous extracts in the (D) ESI+ mode and (E) ESI− model. Permutation testing was carried out for the validation of the OPLS‐DA model. Circles in red represent samples from healthy control, circles in blue represent samples from T2DM patients without pneumonia, and circles in green represent samples from pneumonia patients with T2DM.
