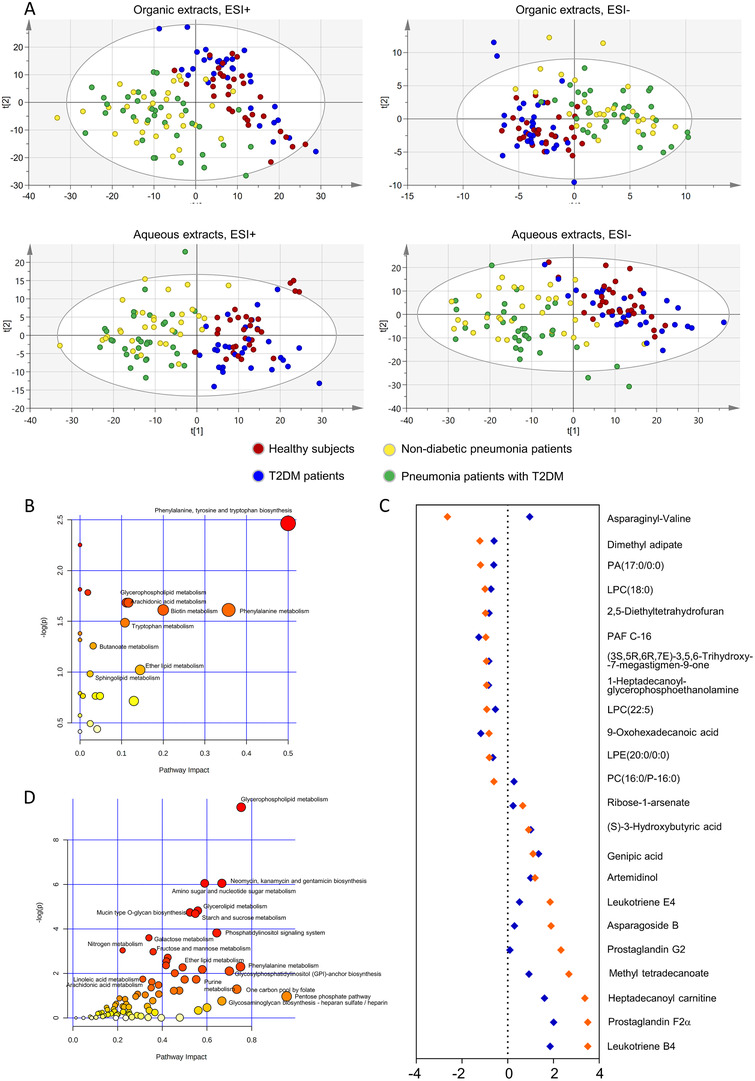
FIGURE 2.

Pathway and enrichment analysis with the differential metabolites. (A) Score plot from PCA of organic extracts in the ESI+ mode and ESI− mode and of aqueous extracts in the ESI+ mode and ESI− model. Healthy subjects (red circle), T2DM without pneumonia (blue circle), non‐diabetic pneumonia patients (yellow circle) and pneumonia patients with T2DM (green circle). (B) Pathway analysis with MetaboAnalyst on the differential metabolites between pneumonia patients with T2DM and healthy subjects or T2DM patients. Each circle in is a representative of a biological pathway and the size of the circle is enumerated based on the importance. (C) Cleveland plots of the differential metabolites between pneumonia patients with T2DM versus healthy subjects whose AUC > 0.85, fold change > 1.5 and p‐value < 0.05. The whole set of metabolites was ranked according to fold changes in the discovery set. The results of the discovery set were shown in orange and the validation set were in blue. (D) The joint pathway analysis by MetaboAnalyst on differential metabolites and genes between pneumonia patients with T2DM group and healthy subject group. Each circle in is a representative of a biological pathway, and the size of the circle is enumerated based on the importance.
