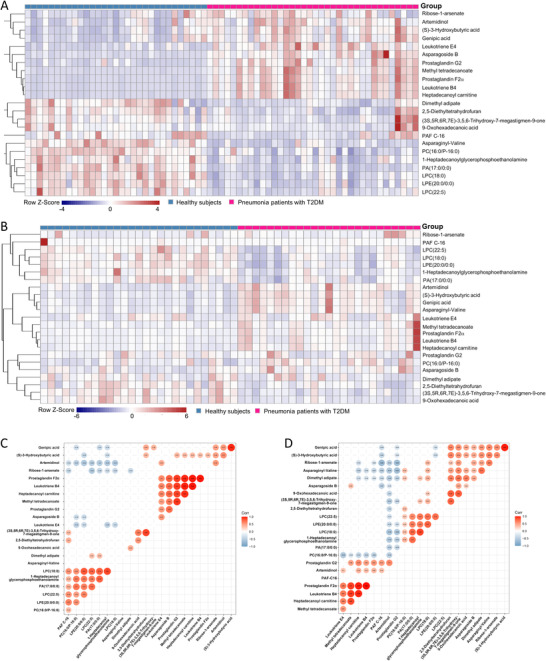
FIGURE 3.

Distribution and correlation analysis of the identified significant differential metabolites between pneumonia patients with T2DM and healthy subjects. (A) The heatmap of the amount of the 23 novel metabolic candidates in pneumonia patients with T2DM group and healthy subject group in the discovery set. (B) The heatmap of the amount of the 23 novel metabolic candidates in pneumonia patients with T2DM group and healthy subject group in the validation set. Correlation coefficients between the 23 most significant differential metabolites in pneumonia patients with T2DM group (C) in the discovery set and (D) in both the discovery and validation set. Only these coefficients of p value < 0.05 were shown.
