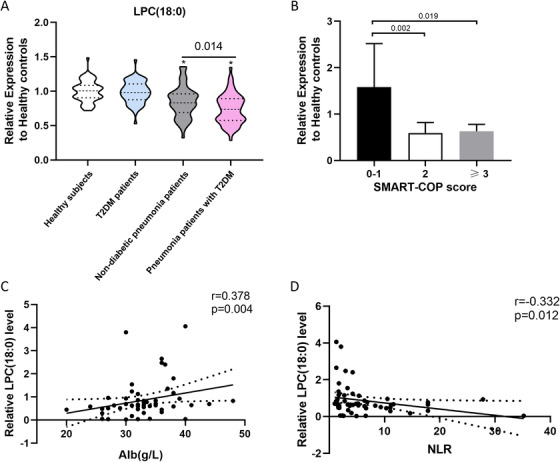
FIGURE 4.

The serum LPC (18:0) level for discriminating non‐diabetic pneumonia patients and pneumonia patients with T2DM. (A) Decreasing trend of serum LPC (18:0) level in pneumonia patients with T2DM in relation to non‐diabetic pneumonia patients. (B) Relative serum LPC (18:0) level in pneumonia patients with T2DM based on SMART‐COP score. (C) Positive correlation between serum LPC (18:0) level and serum albumin level in pneumonia patients with T2DM. (D) Negative correlation between serum LPC (18:0) level and neutrophil‐to‐lymphocyte ratio in pneumonia patients with T2DM. *p < 0.05 represents significant difference for the group compared with the healthy control group
Abbreviation: NLR, neutrophil‐to‐lymphocyte ratio.
