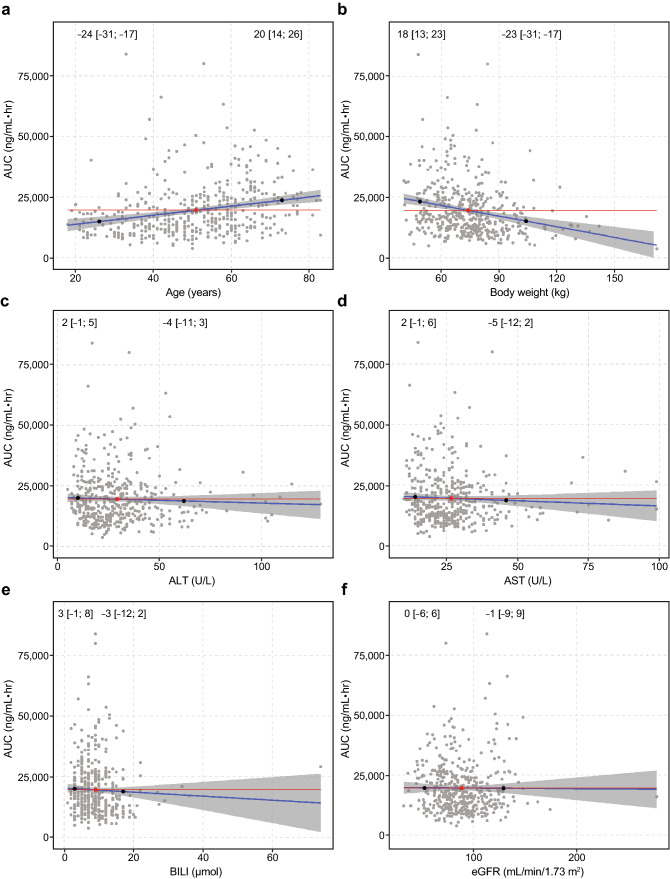
Fig. 2.
Correlations between individual-predicted brigatinib exposure (area under the concentration vs time curve [AUC]) and covariates of a age, b body weight, c alanine aminotransferase (ALT) levels, d aspartate aminotransferase (AST) levels, e total bilirubin, and f estimated glomerular filtration rate (eGFR) based on the final population pharmacokinetic model. Red and black dots represent the median and the 5th and 95th percentiles of the individual covariate values, respectively. Numbers (brackets) are the percent change (95% confidence interval) in the AUC relative to the values at the median, based on the linear regression (blue line) and corresponding 95% confidence interval (shaded region). The red line is the horizontal line passing through the AUC value corresponding to the median covariate value in the population. BILI bilirubin

