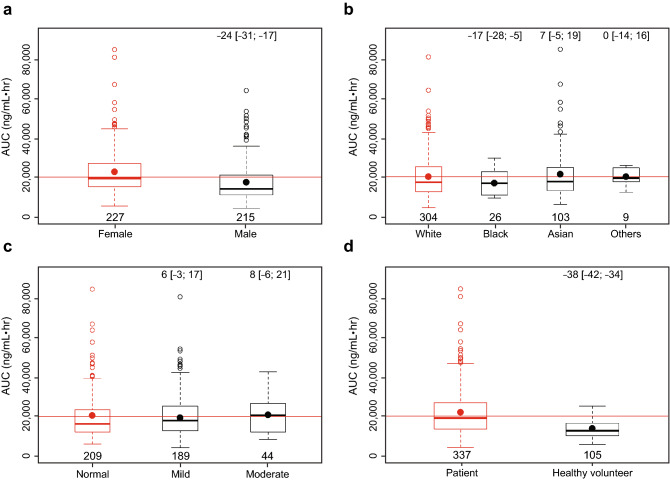
Fig. 3.
Individual-predicted brigatinib exposure (area under the concentration vs time curve [AUC]) by categorical covariates of a sex, b race, c estimated glomerular filtration rate category of impairment, and d patient status (patient with cancer vs healthy volunteer). Red and black dots represent the mean exposure in the reference category and remaining categories, respectively. Numbers (brackets) in the top of the plot are the percent change in AUC (95% confidence interval) relative to the median of the individual covariate values. Red lines represent the median value of the covariate across all groups. Numbers at the bottom of the lower boxplot hinge are the sample size in each category

