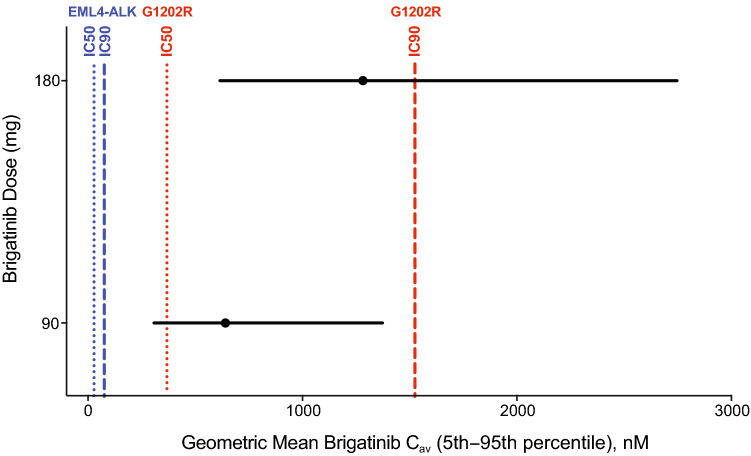
Fig. 5.
Simulated brigatinib average drug concentration at steady state (Cav) at doses of 90 mg and 180 mg (black circles and lines) compared to the concentration of drug producing 50% inhibition (IC50) and concentration of drug producing 90% inhibition (IC90) for native EML4-ALK (blue lines) and the G1202R mutant (red lines). In vitro potency estimates were adjusted upward by a factor of two to account for the observed in vitro potency shift in the presence of plasma proteins

