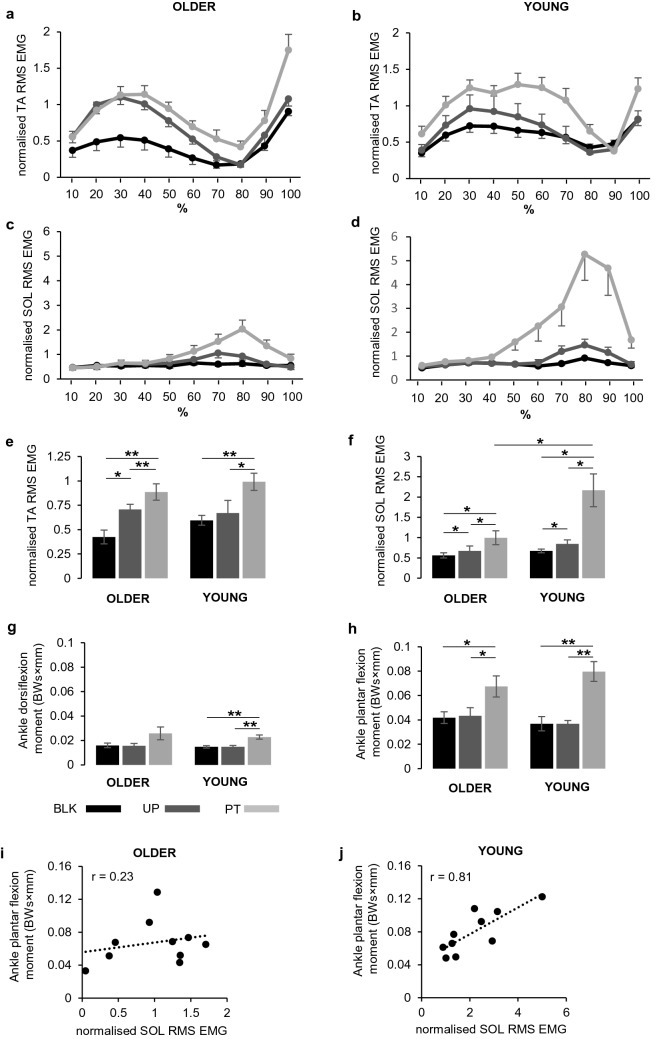
Fig. 3.
Magnitude of muscles activity computed as the root mean square (RMS) of the processed EMG signal over 10% consecutive windows, during the preparatory phase, for each condition. Plots represent the activity of tibialis anterior (TA) in older (a) and young (b) participants and the activity of soleus (SOL) in older (c) and young (d) participants. A summary of statistic results is showed in e for TA and in f for SOL. Data are reported as means and standard errors. Abbreviations, symbols and labels as in Fig. 2

