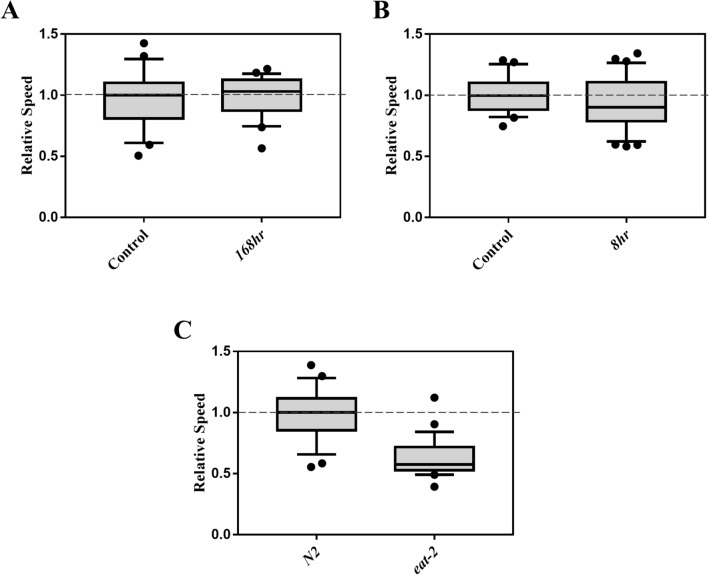
Figure 6.
Effect of starvation on the electrotactic movement. Refer to Fig. 1 for a description of box plot. (A) Electrotaxis of animals starved for 168 h during the L1 larval stage. The speed was unaffected (p = 0.660). (B) Electrotaxis of day-1 adult wild-type animals starved for 8 h. The speed was comparable to the control (p = 0.3350). (C) The speed of eat-2(ad1116) adults was significantly reduced (p < 0.0001). The numbers of animals were (A) Control n = 21, 168 h n = 21. (B) Control n = 22, 8 h n = 25. (C) N2 day-1 adults n = 25, eat-2(ad1116) n = 29. Statistical Analysis was performed using unpaired Student’s t-test.

