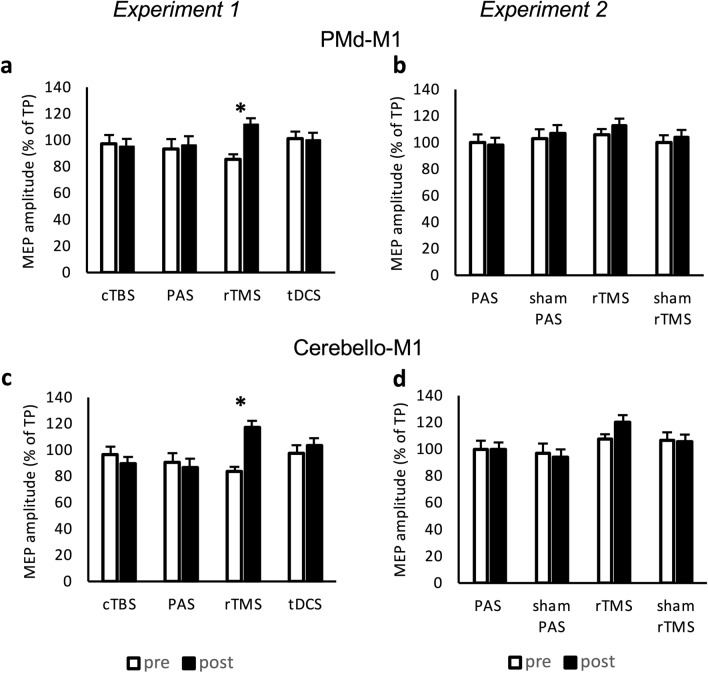
Figure 4.
Analysis of dual-pulse TMS (experiments 1 and 2). MEP amplitudes were measured peak-to-peak and indicated in percentage to the MEP generated while only stimulating the primary motor cortex (M1) with a test pulse (TP). Conditioning pulses over PMd were administered before the TP over M1 within a dual-pulse PMd-M1 paradigm (a and b). Conditioning pulses were given over the cerebellum prior to TP M1 stimulation within the dual-pulse cerebello-M1 paradigm (c and d). Error bars indicate standard error of mean. Graphs are marked with * when comparison of values with student t-test resulted in p value < 0.05 (Bonferroni–Holm-corrected). (a) Significant increase of PMd-M1 interaction only after rTMS intervention (p = 0.004). (b) Increase of PMd-M1 interaction after rTMS intervention without significance (p = 0.250). (c) Significant increase of cerebello-M1 interaction after rTMS intervention (p < 0.001) (d) Increase of cerebello-M1 interaction after rTMS intervention with a trend to significance (p = 0.057). MEP motor evoked potential, TP test pulse over primary motor cortex, PMd dorsal premotor cortex, M1 primary motor cortex, PAS paired associative stimulation, rTMS repetitive transcranial magnetic stimulation, cTBS continuous theta-burst, tDCS transcranial direct current stimulation, ISI interstimulus interval.

