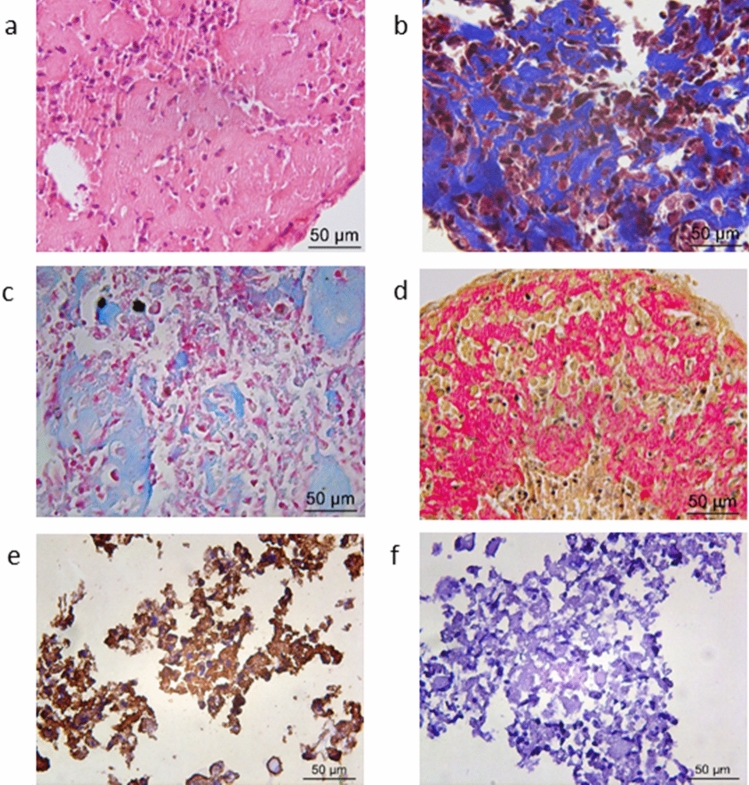
Figure 2.
Micromass results stimulated with IGF-1 for 21 days by chondrogenic differentiation: Histological analysis (400 ×): H&E stain (neoformed matrix appears in pink) (a), Masson’s trichrome (collagens appear in blue) (b), Alcian Blue stain (glycosaminoglycans appear in light blue) (c), and Picrosirius Red stain (collagens fibers appears in red) (d); positive immunohistochemical staining for specific Type II collagen (e) and negative control (f).

