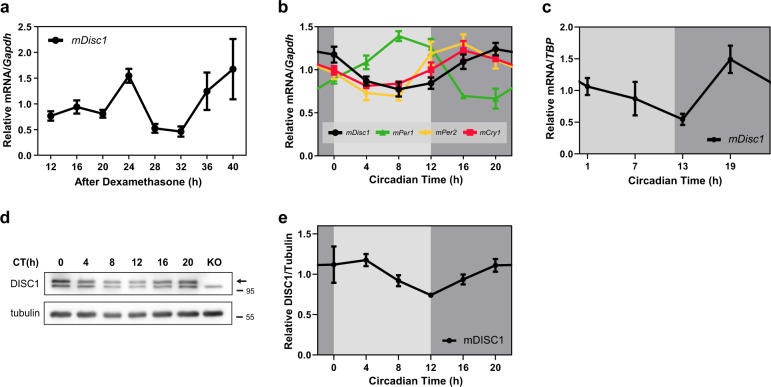
Fig. 1. Expression of DISC1 exhibits an oscillating pattern.
a mRNA expression of Disc1 in NIH3T3 cells. Cells were treated with 1 μM of dexamethasone for 2 h to synchronize the circadian cycle. mRNA levels of Disc1 were analyzed by qRT-PCR and compared to those of Gapdh (n = 5 for 12 h, n = 6 for other time points, biological replicates). The ratios of the relative mRNA levels at each time point to the mRNA levels averaged across all time points were presented. p = 0.0151, one-way ANOVA. b mRNA level of Disc1 in hippocampus of wild type mice (n = 3, 3 mice for each time point) during the circadian time. Mice were entrained on a 12-h light/12-h dark cycle for a week; thereafter, mice were in the constant dark for a day and were sacrificed under dim red light according to their circadian time. mRNA levels of Disc1 were analyzed using qRT-PCR and compared to those of Gapdh. To compare the expression patterns of circadian genes measured by qRT-PCR each other, the ratios of the relative mRNA levels at each time point to the mRNA levels averaged across all time points were presented. p = 0.0037 for Disc1, one-way ANOVA. c mRNA levels of Disc1 in suprachiasmatic nucleus (SCN) of wild type mice (n = 3, 3 mice for 7 h; n = 4, 4 mice for other time points) during the circadian time. mRNA levels of Disc1 were analyzed by qRT-PCR and compared to those of TATA-box binding protein (TBP). The ratios of the relative mRNA levels at each time point to the mRNA levels averaged across all time points were presented. p = 0.0166, one-way ANOVA. d DISC1 protein levels according to the circadian time in hippocampus were assessed by western blot. Wild type mice were entrained on a 12-h light/12-hr dark cycle for a week; thereafter, mice were in the constant dark condition and sacrificed under dim red light according to their circadian time. Disc1 knockout (Disc1-LI mouse) sample was used as a negative control. Arrow indicates DISC1 bands. e Quantification of DISC1 protein level from (d) (n = 4 for each time point, biological replicates). Protein levels were quantified relative to tubulin. The ratios of the relative band intensity at each time point to the band intensities averaged across all time points were presented. p = 0.0042, Welch’s ANOVA. Data are means with SEM.

