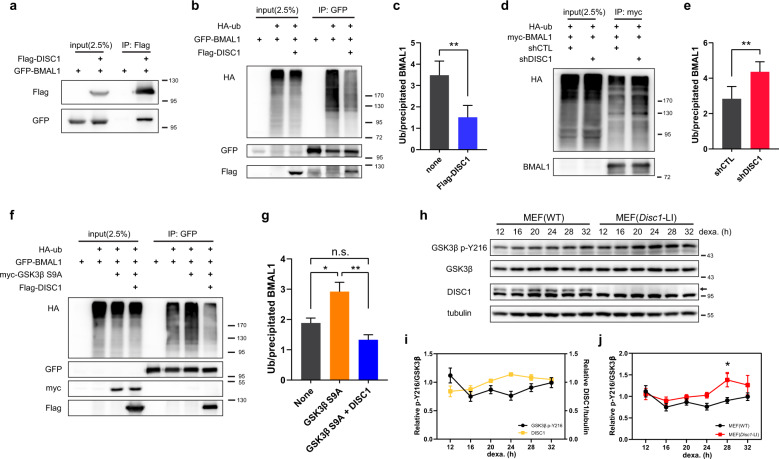
Fig. 5. DISC1 inhibits BMAL1 ubiquitination in association with suppression of Y216 phosphorylation of GSK3β.
a Co-immunoprecipitation of DISC1 and BMAL1. Flag-DISC1 and GFP-BMAL1 were transfected in HEK293 cells and precipitated with Flag-DISC1. b Ubiquitination assay for BMAL1. HA-ubiquitin was transfected in HEK293 cells to assess the ubiquitination of BMAL1. GFP-BMAL1 was transfected with or without Flag-DISC1. c Quantification of ubiquitin level from (b) relative to precipitated BMAL1 level (n = 5, biological replicates). d Ubiquitination assay of BMAL1 with DISC1 knockdown. HA-ubiquitin was transfected in HEK293 cells to assess the ubiquitination of BMAL1. myc-BMAL1 was transfected with shCTL or shDISC1 for knockdown of DISC1. e Quantification of ubiquitin level from (d) relative to precipitated BMAL1 level (n = 4, biological replicates). f Ubiquitination assay of BMAL1 with GSK3β S9A and DISC1. HA-ubiquitin was transfected in HEK293 cells to assess the ubiquitination of BMAL1. GFP-BMAL1 was transfected with myc-GSK3β S9A and Flag-DISC1 according to each combination of constructs. g Quantification of ubiquitin level from (f) relative to precipitated BMAL1 level (n = 4, biological replicates). h Western blot analysis of Y216 phosphorylation of GSK3β in wild type and Disc1 knockout (Disc1-LI) MEFs. MEFs were treated with 1 μM of dexamethasone to synchronize the circadian cycle. Western blot of GSK3β was conducted in different gel from others to avoid re-probing interference from previous band blot (p-Y216 GSK3β). Western blot was conducted in parallel with the same amount of identical samples. i Quantification of DISC1 and Y216 phosphorylation of GSK3β from (h) (n = 6, n = 3 for DISC1, biological replicates). Relative intensities of DISC1 and p-Y216 GSK3β relative to tubulin and total GSK3β, respectively, were subjected to analyses. The ratios of the relative band intensity at each time point to the band intensities averaged across all time points were presented. j Quantification of Y216 phosphorylation levels in wild type and Disc1 knockout MEFs from (h) (n = 6, biological replicates). The intensity of p-Y216 GSK3β relative to total GSK3β was subjected to analyses. The ratios of the relative band intensity at each time point to the band intensities averaged across all time points were presented. Data are means with SEM. *p ≤ 0.05, **p ≤ 0.01, paired t-test for (c, e), one-way ANOVA and Tukey’s post-hoc test for (g), two-way ANOVA and Sidak’s multiple comparisons for (j).

