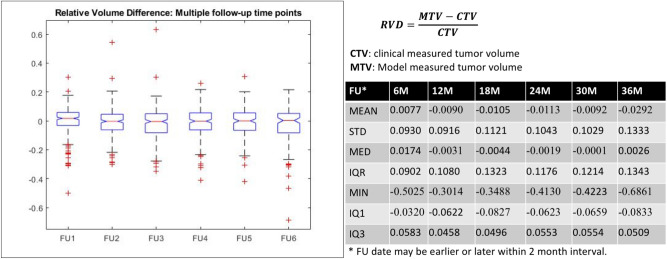
Figure 2.
Longitudinal analysis of parametric MR images from 381 VS patients. Regardless of the state of the tumor (progressed, pseudo-progressed, or regressed), there were negligible differences between the predictions of the proposed AI model and clinical measurements obtained by expert radiologists. The median differences are presented here at each follow-up time point: + 1.74%, − 0.31%, − 0.44%, − 0.19%, − 0.01%, and + 0.26 (Mean: average, Std: standard deviation, MIN: minimum, IQ1: 25th interquartile, IQ3: 75th interquartile, MED: median, MAX: maximum).

