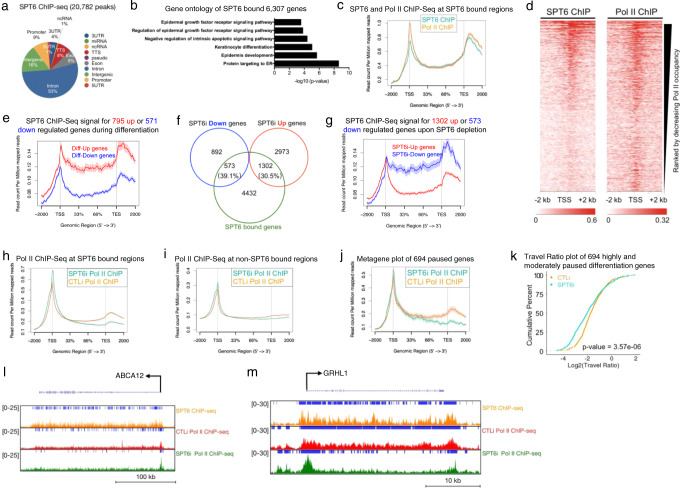
Fig. 3. SPT6 binds to epidermal differentiation genes and is necessary for their transcriptional elongation.
a Genomic localization of the 20,782 SPT6 bound peaks. SPT6 ChIP-Seq was performed in replicates from day 3 differentiated keratinocytes. b Gene ontology terms of the 6307 genes that the 20,782 SPT6 bound peaks mapped back to. c Metagene plot of SPT6 (teal) and RNA Pol II (orange) ChIP-Seq reads at SPT6 bound regions. Y-axis is shown as read count per million reads and X-axis is distance along SPT6 bound genes. d Heatmap of SPT6 and Pol II ChIP-Seq ranked by decreasing Pol II occupancy. X-axis shows −2 kb to +2 kb from the TSS. e SPT6 ChIP-Seq signal for the 795 genes upregulated upon differentiation (Diff-Up) is shown in red. SPT6 ChIP-Seq signal for the 571 genes downregulated upon differentiation (Diff-Down) is shown in blue. Read count per million mapped reads is shown on the Y-axis. The X-axis represents regions across genes. TSS is transcription start site and TES is transcription end site. Average values are shown between experiments. f Venn diagram of SPT6 bound genes (SPT6 ChIP-Seq) with genes increased or decreased upon SPT6 depletion. g SPT6 ChIP-Seq signal for the 1302 genes upregulated upon SPT6 knockdown (SPT6i-Up genes) is shown in red. SPT6 ChIP-Seq signal for the 573 genes downregulated upon SPT6 loss (SPT6i-Down genes) is shown in blue. Read count per million mapped reads is shown on the Y-axis. The X-axis represents regions across genes. TSS is transcription start site and TES is transcription end site. Average values are shown between experiments. h Plot of CTLi (orange) and SPT6i (teal) Pol II ChIP-Seq at SPT6 bound regions. Y-axis is shown as read count per million reads and X-axis is distance along SPT6 bound genes. CTLi and SPT6i Pol II ChIP-Seq in differentiation conditions were performed in replicates. i Plot of CTLi (orange) and SPT6i (teal) Pol II ChIP-Seq at non-SPT6 bound regions. j Plot of CTLi (orange) and SPT6i (teal) Pol II ChIP-Seq at the 694 differentiation genes paused in proliferation conditions. k Travel ratio plot of the 694 differentiation genes paused in proliferation conditions. The average travel ratio of those genes in CTLi (orange) and SPT6i (teal) cells in differentiation conditions is shown. The Y-axis shows the cumulative percentage of genes and X-axis shows the travel ratio plotted in Log2. p value calculated using two-sided Fisher’s Exact test. Gene tracks of ABCA12 (l) and GRHL1 (m). SPT6 ChIP-Seq in differentiation conditions is shown in orange. CTLi (red) and SPT6i (green) Pol II ChIP-Seq in differentiation conditions are also shown. Y-axis shows reads per million and blue bar over gene tracks represent significant peaks.

