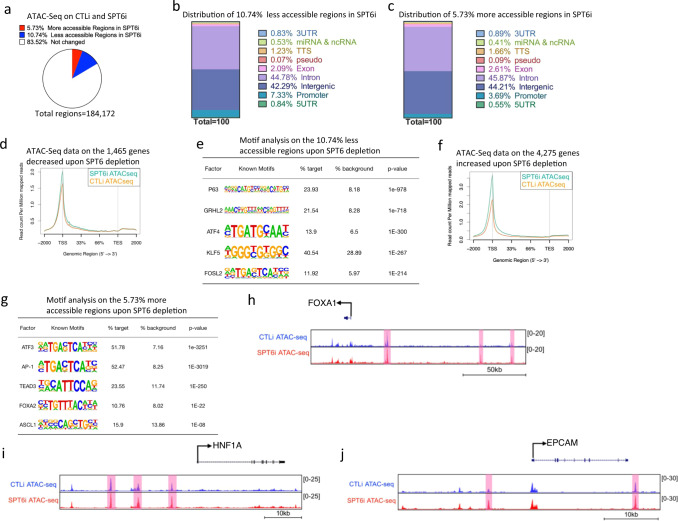
Fig. 5. Depletion of SPT6 leads to loss of chromatin accessibility for P63 binding sites and gain of accessibility for transcription factors specifying other lineages.
a Pie chart of the percentage of regions with more or less accessible chromatin upon SPT6 depletion. CTLi and SPT6i samples were differentiated for 3 days and subjected to ATAC-Seq. N = 2 independent experiments. b Distribution of regions with less accessible chromatin upon SPT6 knockdown. c Distribution of regions with more accessible chromatin upon SPT6 loss. d ATAC-Seq signal for the 1465 genes reduced in expression upon SPT6 knockdown. ATAC-Seq signal for CTLi is shown in orange while SPT6i is shown in teal. Read count per million mapped reads is shown on the Y-axis. The X-axis represents regions across genes. TSS is transcription start site and TES is transcription end site. e Transcription factor motif search for the 10.74% regions with less accessible chromatin upon SPT6 knockdown. p value calculated using hypergeometric distribution. f ATAC-Seq signal for the 4275 genes increased in expression upon SPT6 knockdown. ATAC-Seq signal for CTLi is shown in orange while SPT6i is shown in teal. g Transcription factor motif search for the 5.73% regions with more accessible chromatin upon SPT6 knockdown. p value calculated using hypergeometric distribution. Gene tracks showing intestinal genes FOXA1 (h), HNF1A (i), and EPCAM (j). ATAC-Seq signals for CTLi (blue) and SPT6i (red) are shown. Regions marked in pink denote increased chromatin accessibility upon SPT6 depletion. Y-axis represents reads per million. X-axis denotes regions along the gene.

