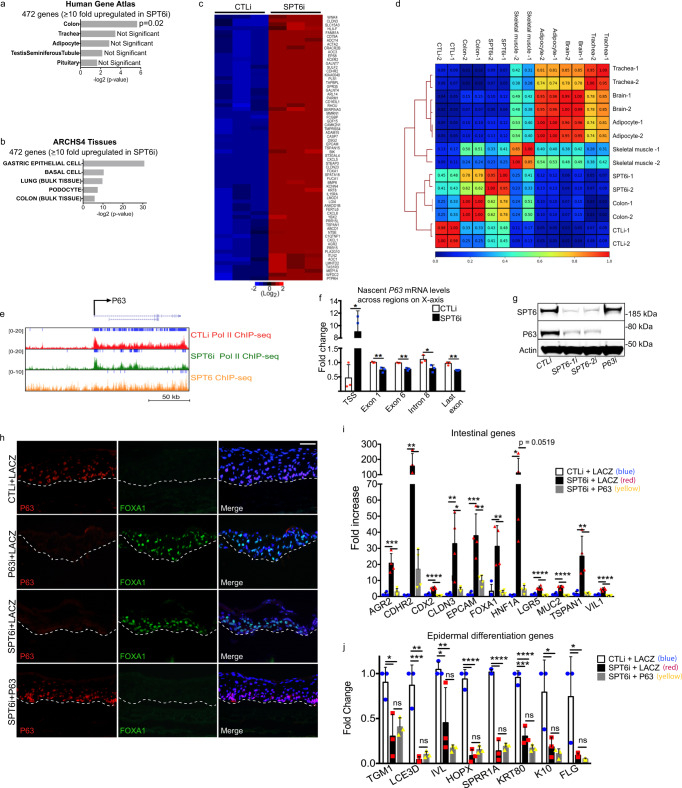
Fig. 6. Depletion of SPT6 leads to an intestinal-like phenotype due to loss of P63 expression.
a The top 472 genes upregulated upon SPT6 depletion were searched in the Human Gene Atlas database to determine tissues with most similar gene expression using hypergeometric distribution. b The top 472 genes upregulated upon SPT6 depletion were used in the ARCHS4 database to determine tissues or cell types with most similar gene expression using hypergeometric distribution. c Heatmap of the intestinal genes (from the ARCHS4 database) upregulated upon SPT6 knockdown. Heatmap is shown in Log2. d Pearson correlation and clustering of CTLi and SPT6i gene expression signatures with brain, colon, adipocyte, trachea, and skeletal muscle. Replicate RNA-Seq samples are shown for each tissue. e Gene track of P63. SPT6 ChIP-Seq is shown in orange. CTLi (red) and SPT6i (green) Pol II ChIP-Seq are also shown. Y-axis shows reads per million and blue bars over gene track represent significant peaks. f Measurement of nascent P63 mRNA levels in CTLi and SPT6i cells differentiated for 3 days. Cells were pulsed with 5-ethynyl uridine for 4 h and nascent transcripts purified. Levels of nascent P63 mRNA levels were measured using RT-QPCR at the regions shown on the X-axis. N = 3 independent experiments, mean values are shown with error bars = SD, two-sided t-test. * = 0.012 for TSS, ** = 0.0074 for exon 1, ** = 0.0012 for exon 6, * = 0.044 for intron 8, ** = 0.0024 for last exon. g Western blot for SPT6 and P63 protein levels in CTLi, SPT6-1i, SPT6-2i, and P63i cells. Representative image is shown, n = 3 independent experiments. h Immunofluorescent staining of P63 (red) and FOXA1 (green) in day 6 regenerated human epidermis. Samples include CTLi + LACZ, P63i + LACZ, SPT6i + LACZ, and SPT6i + P63. LACZ and P63 are exogenous retroviral expression of the open reading frames of each gene. Merged image includes Hoechst staining of nuclei. n = 3 independent experiments, scale bar = 60 μm. i RT-qPCR quantifying the relative mRNA expression levels of intestinal genes in regenerated human epidermis (day 6). Samples include CTLi + LACZ, SPT6i + LACZ, and SPT6i + P63. LACZ and P63 are exogenous retroviral expression of the open reading frames of each gene. qPCR values were normalized to L32. N = 4 independent experiments. p = 0.0008 for AGR2, p = 0.0089 for CDHR2, p = 0.0002 for CDX2, p = 0.0165 for CLDN3, p = 0.0018 for EPCAM, p = 0.0062 for FOXA1, p = 0.0006 for LGR5, p = 0.0004 for MUC2, p = 0.0099 for TSPAN1, p = 0.0004 for VIL1. j RT-qPCR quantifying the relative mRNA expression levels of epidermal differentiation genes in regenerated human epidermis (day 6). Samples include CTLi + LACZ, SPT6i + LACZ, and SPT6i + P63. LACZ and P63 are exogenous retroviral expression of the open reading frames of each gene. qPCR values were normalized to L32. N = 3 independent experiments. p = 0.0241 for TGM1, p = 0.0033 for LCE3D, p = 0.0003 for HOPX, p = 0.0002 for SPRR1A, p = 0.0009 for KRT80, p = 0.0478 for K10. ns not significant. Mean values are shown with error bars = SD. *p < 0.05, **p < 0.01, ***p < 0.001, ****p < 0.0001 (two-sided t-test for i, j).

