
Figure 3.
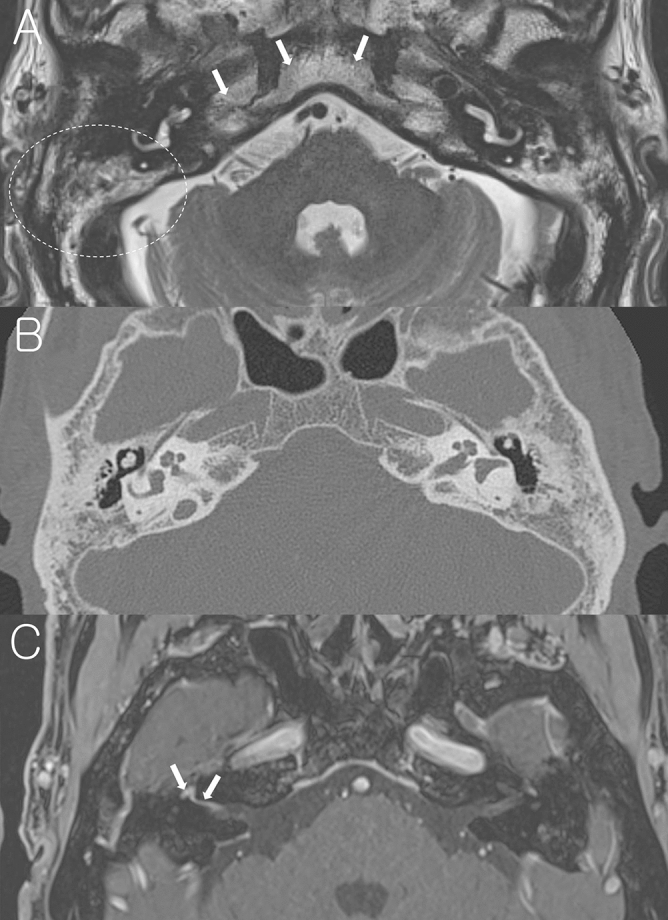
A representative case of Bell’s palsy with sclerotic mastoid. (A) Non-contrast axial T2-weighted image at the level of IAC shows heterogeneous high signal intensity in the mastoids (dotted circle) which have similar signal intensity from the adjacent clivus and petrous apex (arrows), suggesting bony sclerotic change. (B) Temporal bone CT confirms bony sclerotic change and decreased number of mastoid air cells. (C) Post-contrast axial T1-weighted image at the Bill’s bar shows enhancement of the distal canalicular, labyrinthine, genu and proximal tympanic segment of the right facial nerve (arrows).