Figure 4.
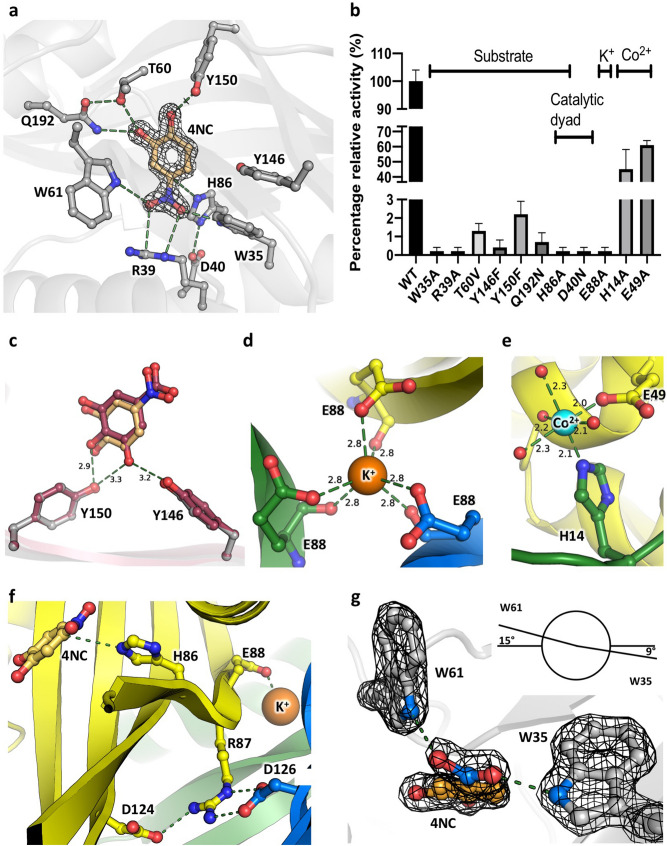
The ligand-binding sites in AGDC1. (a) The active site of AGDC1 with bound 4-NC. The 2Fo-Fc density map for 4NC is shown as an isosurface mesh contoured at 2σ. (b) Percentage enzyme activity of mutants relative to that of the wild-type. The assay had 0.5 mM gallate, 50 mM KPi, pH 6.5, 250 µM CoCl2, and 40 µg/ml protein. The labels on top indicate the role of mutated residues—ligand binding or catalytic mechanism. (c) Induced-fit docking of the natural substrate gallic acid (GA). The crystal structure (colored grey for protein residues and gold for 4NC) is overlaid with the docking results (colored red for the protein residues and GA). K+ (d) and Co2+ (e) binding sites. (f) The substrate- and K+-binding sites are connected through a twisted beta-strand β3, with H86 and E88 on each side of the twist. (g) The tryptophan clamp made up of W35 and W61 twists the nitro-moiety of 4NC with respect to the benzyl ring through hydrogen bond interactions between the amines of the respective indole rings and the oxygen atoms of the ligand nitro-group. A twist of up to 24° (PPP2) could be observed in the crystal structures directly. W35, W61, and 4NC are shown in 2Fo-Fc electron density contoured at 2σ. The Newman projection indicates the dihedral angles measured respective to the aromatic plane. Panel (g) depicts the PPP2 complex, all other panels show AGDC1. The ions are displayed as spheres (K+: orange, Co2+: cyan). Bonding interactions are indicated by green dashed lines. Distance labels are in Å.

