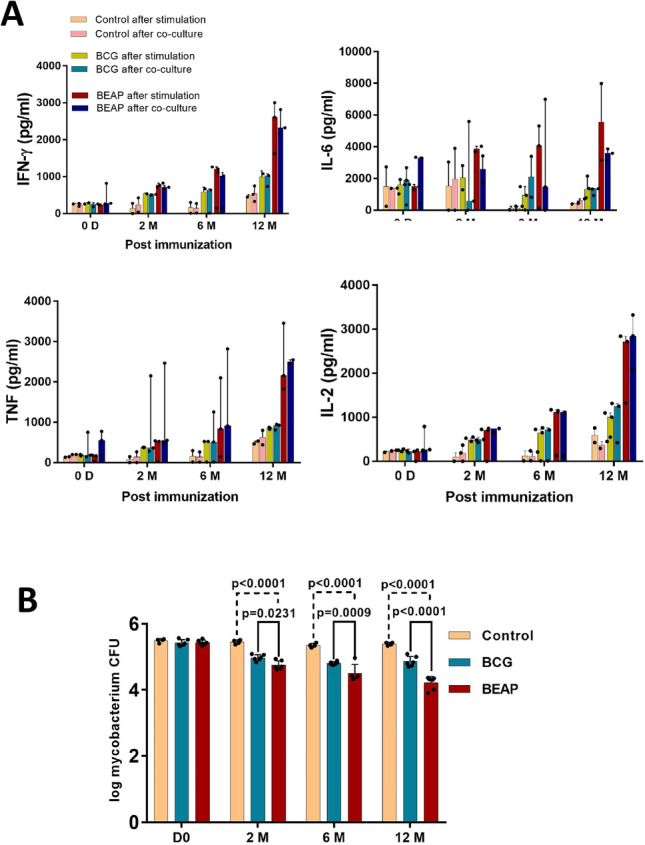
Figure 3.

Efficacy and immune response elicited by BCG/BEAP. (A) The cytokine secretion profile in the supernatant of M.tb antigen stimulated T cells and when activated T cells were co-cultured with M.tb infected macrophages from the respective animals. Dots indicate data points and bars are median with 95% confidence interval. (B) Mycobacterium colony-forming units obtained after M.tb infected macrophages and activated T cells were co-cultured. The data demonstrate a substantial decrease in the mycobacterium CFU in the BEAP and BCG immunization compared to control animals. Dots indicate CFU counts calculated from multiple plates and bars are mean ± SD and analysis was done using two-way ANOVA with Tukey’s correction for multiple comparisons. Graphs were plotted using GraphPad Prism version-7 program (https://www.graphpad.com/).
