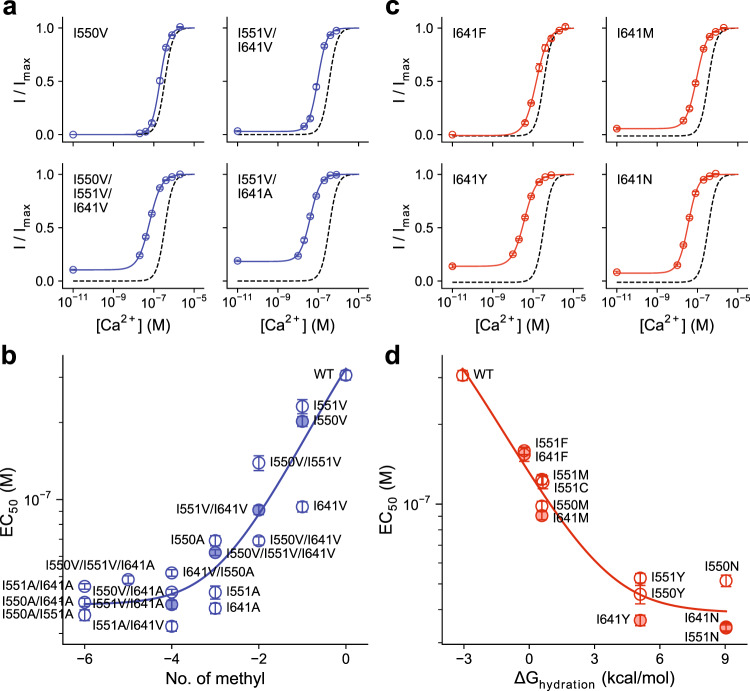
Fig. 4. Energetic contribution of hydrophobic volume and hydration energy of gate residues.
a Selected concentration-response relations of mutants with decreasing hydrophobic volume of gate residues. b Relationship between EC50 change and hydrophobic volume decrease. The effective contribution of each methyl group was estimated to be 0.83 ± 0.21 kcal/mol in stabilizing the closed state. c Selected concentration-response relations of mutants with increasing hydrophilicity of gate residues. d Relationship between EC50 change and hydration energy. The fractional contribution of the residues’ hydration energy was estimated to be 0.37 ± 0.11 in stabilizing the open state. a, c Data are averages of the indicated number of patches shown in Supplementary Tables 4 and 5 respectively, errors are SEM. Solid lines are fits to the Hill equation. Dashed lines are the relation of WT. b, d Filled symbols correspond to the mean EC50 of the mutants shown in a and c respectively. Data are averages of the indicated number of patches shown in Supplementary Tables 4 and 5 respectively, errors are SEM. Solid line is a fit to an MWC-type gating model (Eqs. 4–8, see “Methods”). The two series were fitted globally with shared binding constants. The errors of the estimates correspond to 95% confidence intervals.

