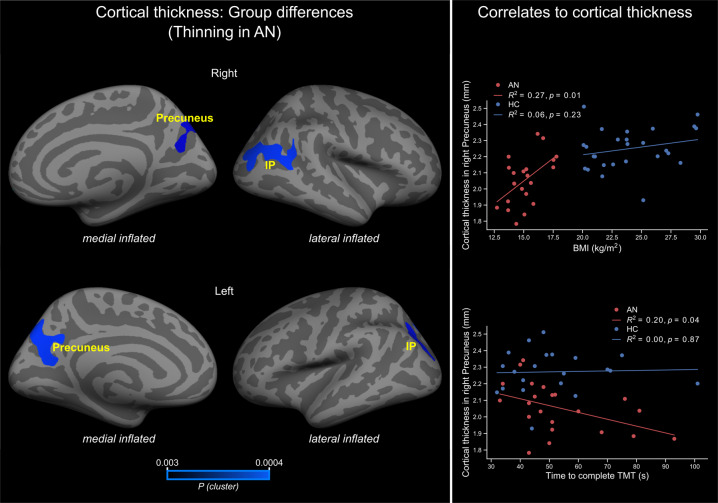
Fig. 1. Whole-brain group differences in cortical thickness and correlation with BMI and TMT-B.
Left, brain regions showing significantly cortical thickness differences between AN and healthy controls. Right, correlation between cortical thickness in the right precuneus with BMI (top) and time to complete TMT-B (bottom). Colorbar shows cluster-level family-wise corrected p-values (CWP). Abbreviations: IP = inferior parietal; AN = anorexia nervosa; HC = healthy controls; R2 = variance explained; p = p-value; BMI = body mass index; TMT = Trail Making Test.

