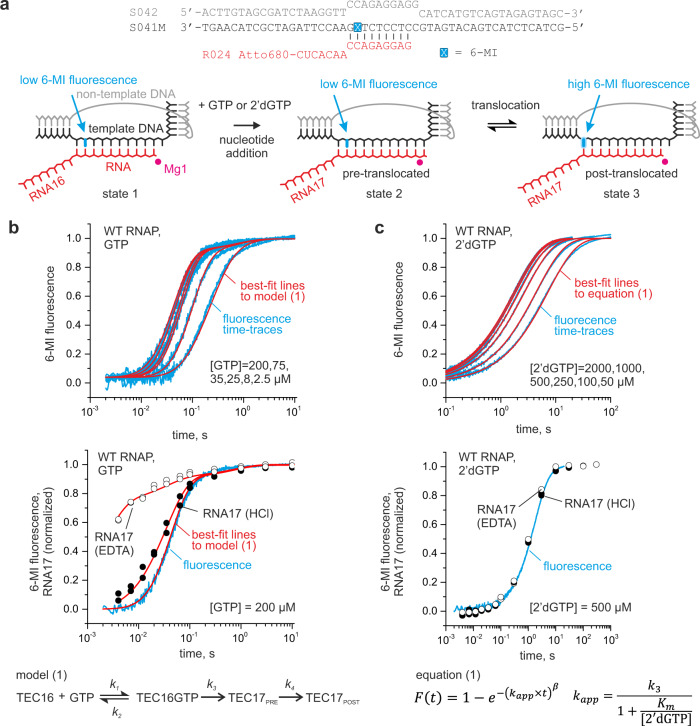
Fig. 2. Time-resolved measurements of GTP and 2′dGTP utilization by the WT E. coli RNAP.
a The nucleic acid scaffold employed in translocation and nucleotide addition assays. The fluorescence of a guanine analog 6-MI (cyan) was quenched by neighboring base pairs in the initial TEC (state 1) and the pre-translocated TEC that formed following the nucleotide incorporation (state 2) but increased when the 6-MI relocated to the edge of the RNA:DNA hybrid upon translocation (state 3). The template DNA, non-template DNA, RNA, and the catalytic Mg2+ ions are colored black, gray, red, and magenta, respectively. b GTP concentration series. The data were fit to model (1). c 2′dGTP concentration series. The data were fit to equation (1). The best-fit lines and fluorescence time-traces are colored red and cyan, respectively. The HCl and EDTA quenched data points are shown as closed and opened circles, respectively. All experiments were performed in duplicate with similar results, duplicate data were combined for the analysis. Source data are provided as a Source Data file.

