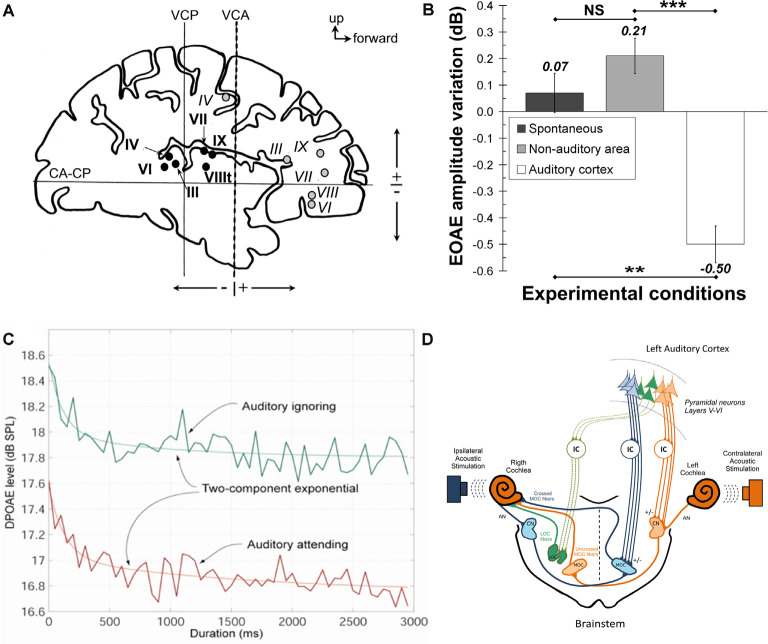
Figure 1.
(A,B) Illustration of the experiment by Perrot et al. (2006) showing electrical stimulation sites in the human auditory cortex in panel (A). Black circles = auditory cortex stimulation sites, gray circles = non-auditory cortex stimulation sites, Roman numerals correspond to the individual patients. CA-CP, plane passing through the anterior and posterior commissures; VCA, vertical plane passing through the anterior commissure; VCP, vertical plane passing through the posterior commissure. Panel (B) shows the change in the variation in the amplitude of evoked otoacoustic emissions (EOAEs) under spontaneous conditions (dark bar), after stimulation in the non-auditory cortex (gray bar), and after stimulation in the auditory cortex (white bar). These data illustrate that human auditory cortical stimulation diminishes the variability of evoked otoacoustic emissions. **P < 0.01; ***P = 0.001; NS, not significant using paired t-tests. Standard error of the mean is shown using error bars. Data obtained with permission from Perrot et al. (2006). Panel (C) Illustrates the impact of attending to an auditory stimulus on distortion product otoacoustic emissions (DPOAEs). As shown, attending to an acoustic stimulus diminishes the DPOAE amplitude (red trace), compared to ignoring that stimulus (green trace). Data obtained with permission from Smith et al. (2012). (D) Illustration of a model proposed by Terreros and Délano (2015)to explain the influence of the cortex on the cochlea. They propose multiple potential pathways from the auditory cortex, involving the inferior colliculus and the superior olivary nuclei, to impact the outer hair cells via the medial olivocochlear bundle. Figure obtained with permission from Terreros and Délano (2015).

